


FortiAnalyzer Version 3.0 MR7 Administration Guide
116 05-30007-0082-20080908
Configuring reports Reports
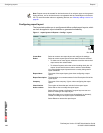
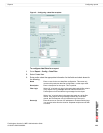
4 Select [Add Chart(s)].
5 Enter the appropriate information for the following:
6 Select OK.
If you want to edit charts immediately after configuring them, go to the procedure
“To edit a chart” on page 117.
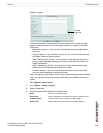
7 Select [Add Section].
8 Enter the appropriate information for the following:
9 Select OK.
10 Select [Add Text].
11 In the Message field, enter a sentence or paragraph to include a message at the
bottom of the report.
12 Select OK.
If you want to rearrange the order of the charts, use your mouse to drag and drop
each chart so that they are arrange in the order you want.
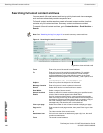
Title Page Logo Select the Browse logo files icon to choose a logo that will
appear on the title page of the report. You need to select a logo
file format that is compatible with your selected file format
outputs. The logo will not appear if it is incompatible with the
chosen file format.
You can choose JPG, PNG, and GIF logo formats for PDFs
and HTMLS; WMF are also supported for RTF.
Header Logo Select the Browse logo files icon to choose a logo that will
appear only in the header of the report. Logo formats for
headers also need to be compatible with the chosen file
format. The same logo formats for the title page also apply to
headers.
Device Type Select one of the device types from the drop-down list. The available
types are FortiGate, FortiClient and FortiMail. The report’s log
information will come from the selected device type. For example, if
you selected FortiMail, the log information used is only FortiMail logs.
Note: Charts reflect what type of device you selected.
Category Select a category or all categories of charts from the drop-down list.
Chart Name Displays the name of each of the charts in each
category. The category name is in bold, and the
charts associated within that category name are
displayed beneath.
Action Select the plus (+) symbol in the row containing
the main chart name to add all charts of the
category to the report.
Select the plus (+) symbol in each row to add
charts individually.
When the plus (+) symbol is selected, a minus (-)
symbol appears. Select the minus (-) symbol in
each row to remove the selected chart or chats.
Title Enter a title to describe the charts and information.
Description Enter a description, if applicable, to describe the charts.
Note: Report layouts cannot be deleted if they are associated with a report
schedule; if you want to delete a report layout, remove that layout from the
schedule it is associated with, and then delete it.