


FortiAnalyzer Version 3.0 MR7 Administration Guide
32 05-30007-0082-20080908
Dashboard System
System Resources
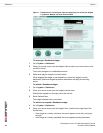
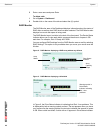
The System Resources area of the Dashboard displays use of the FortiAnalyzer
unit’s resources, including CPU, memory (RAM) and hard disk.
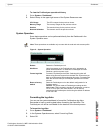
Figure 8: System Resources
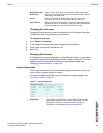
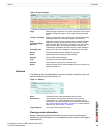
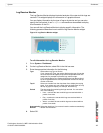
Viewing operational history
The System resource history page displays four graphs representing system
resources and network utilization history, updated every three seconds.
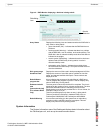
RVS Plug-ins The version of the RVS plug-in, and the date of its last update.
This feature is not available on the FortiAnalyzer-100.
Device License
A total of the number of each device type connecting or attempting
to connect to the FortiAnalyzer unit. For more information about
the maximum numbers of devices of each type and/or VDOMs
that are permitted to connect to the FortiAnalyzer unit, see
“Maximum number of devices” on page 76.
• Registered is the number of devices that you have added to
the FortiAnalyzer unit’s device list, either manually or
automatically.
• Unregistered is the number of devices attempting to connect to
the FortiAnalyzer unit that are not yet registered. To configure
the FortiAnalyzer unit to accept data from a device, see
“Manually adding a device” on page 80.
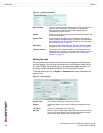
CPU Usage The current CPU usage status. The web-based manager displays
CPU usage for core processes only. CPU usage for management
processes (for example, for HTTPS connections to the web-based
manager) is excluded.
Memory Usage The current memory status. The web-based manager displays
memory usage for core processes only. Memory usage for
management processes (for example, for HTTPS connections to
the web-based manager) is excluded.
Hard Disk Usage /
RAID status
For the FortiAnalyzer-100 and FortiAnalyzer-100A/100B, the
current status of the hard disk. The web-based manager displays
the amount of hard disk space used.
For the FortiAnalyzer-400, FortiAnalyzer-800/800B,
FortiAnalyzer-2000/2000A and FortiAnalyzer-4000/4000A, the
current RAID status of the hard disks. Each circle indicates the
status of a hard disk. Green indicates the hard disk is functioning
normally. If the disk is flashing red and yellow, there is a problem
with the hard disk.
The hard disks on the FortiAnalyzer-2000/2000A and
FortiAnalyzer-4000/4000A are hot swappable. For more
information, see “Hot swapping the FortiAnalyzer-2000/2000A and
FortiAnalyzer-4000/4000A” on page 66.
History icon Select History, which appears when placing the mouse cursor
over the title bar, to view a graphical representation of the last
minute of CPU, memory, sessions, and network usage. For more
information, see “Viewing operational history” on page 32.