


What’s new for 3.0 MR7 3.0 MR7 new features and changes
FortiAnalyzerVersion 3.0 MR7 Administration Guide
05-30007-0082-20080908 15
3.0 MR7 new features and changes
The following descriptions includes only menus containing new features, changes
to features, or both. Additional information is provided within this document.
Power supply monitoring for FortiAnlayzer-2000A and 4000A
In FortiAnalyzer 3.0 MR7, the new feature power supply monitoring provides a
notification when a power supply fails or an administrator adds a power supply to
the system. This notification is sent by the hardware monitoring daemon and in
the following forms:
• Log – a log message is recorded at the system level
• Email – an email is sends out a critical event email message
• SNMP trap – a power supply event trap is sent
Both the web-based manager and CLI include settings for this new feature.
Registered devices’ hard limits
In previous FortiAnalyzer 3.0 releases, the license limits of registered devices was
reduced, causing those registered devices to not carry forward. The limit is now
back to the maximum limit in FortiAnalyzer 3.0 MR4. This limit number prevents
any loss of registered devices during upgrade. You can view the limits for
registered devices on “Maximum number of devices” on page 76 in the Device
chapter.
CLI displays the tasks in the upload queue
A new diagnose command, diagnose upload status, has been added in
FortiAnalyzer 3.0 MR7 for displaying files that are in the upload queue. Previously,
in FortiAnalyzer 3.0 MR6, a queue maintained the upload’s tasks but there was no
way of verifying what was and what was not included in the queue.
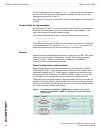
Dashboard enhancements
The Dashboard contains nine new widgets in FortiAnalyzer 3.0 MR7.
Administrators can have up to five tabs to the Dashboard as well.
Tabs allow administrators to customize what widgets display, for example, if
administrators only need to view traffic widgets a tab can be configured so that it
only displays all the traffic widgets.
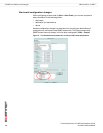
The following are the new widgets that are available for display on the Dashboard:
• Log Receive Monitor
• RAID Monitor (if RAID is available on the FortiAnalyzer unit)
•Top Traffic
• Top Web Traffic
• Top Email Traffic
•Top FTP Traffic
• Top IM/P2P Traffic
• Virus Activity
• Intrusion Activity