


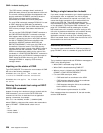

CETR—trace control
Chapter 16. CETR—trace control
Use CETR to control CICS tracing activity.
Start the transaction by typing CETR on the command line of
your display, as follows:
CETR
Press the ENTER key.
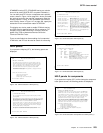
You get the following display, with the values of your own
system in each of the fields.
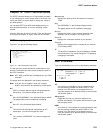
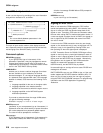
CETR CICS/ESA Trace Control Facility CI41 IYAHZCCV
Type in your choices.
Item Choice Possible choices
Internal Trace Status ===> STARTED STArted, STOpped
Internal Trace Table Size ===> 16 K 16K - 148576K
Auxiliary Trace Status ===> STOPPED STArted, STOpped, Paused
Auxiliary Trace Dataset ===> B A, B
Auxiliary Switch Status ===> NO NO, NExt, All
GTF Trace Status ===> STOPPED STArted, STOpped
Master System Trace Flag ===> ON ON, OFf
Master User Trace Flag ===> ON ON, OFf
When finished, press ENTER.
PF1=Help 3=Quit 4=Components 5=Ter/Trn 9=Error List
Figure 145. CETR transaction: initial screen
Any of the input fields can be overtyped with the new values
that you require. When you press ENTER, CETR issues the
necessary commands to set the new values. If there are any
errors, PF9 can be pressed to display the error messages. If
there is only one short error message, it appears near the
bottom of this display.
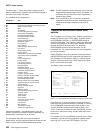
The following table shows the relationships between the
auxiliary trace status, trace flag, and trace data set.
Two other main functions of CETR are:
1. Setting the component trace options (press PF4)
2. Setting the transaction and terminal trace options (press
PF5).
For information about the use of the various CETR options
as an aid to problem determination, see the
CICS Problem
Determination Guide
.
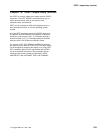
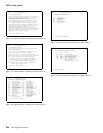
Component trace options
The “Component Trace Options” display is produced by
pressing PF4 on the main CETR display. You get the
following display, with the values of your own system in each
of the fields.
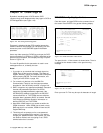
CETR Component Trace Options CI41 IYAHZCCV
Over-type where required and press ENTER. PAGE 1 OF 3
Component Standard Special
-------- ------------------------------- -------------------------------
AP 1 1-2
| BA 1 1-2
BF 1 1
BM 1 1
BR 1 1-2
CP 1 1-2
DC 1 1
DD 1 1
DI 1 1
DM 1 1-2
DS 1 1-2
DU 1 1-2
EI 1 1
| EM 1 1-2
FC 1 1-2
GC 1 1-2
IC 1 1
PF: 1=Help 3=Quit 7=Back 8=Forward 9=Messages ENTER=Change
Figure 146. CETR transaction: component trace options screen
PF7 and PF8 can be used to scroll backward and forward
through the list of components. PF9 gives the error message
list.
The trace levels for a particular component are represented
by two values. One gives the active level of tracing for
standard tracing; the other gives the level for special tracing.
From the list of components, you can set the active level of
tracing for standard and/or special tracing for each individual
component. See the
CICS Problem Determination Guide
for
an explanation of standard and special tracing, and of tracing
levels.
The values are in the range 1 through 32 for most
components. In practice, you will normally want to use an
active level of ‘1’ for any component, and you do this by
overtyping (if necessary) the displayed value under the
relevant heading for the required component.
In certain circumstances, if you have referred a problem to
the IBM System Support Center staff, they may ask you to
get a level ‘2’ trace. You will need to specify both level 1 and
2 to get all of the trace points that are needed.
You can specify a range of tracing levels—normally levels ‘1’
and ‘2’. You do this by overtyping the displayed value with
‘1-2’ or ‘1,2’.
Alternatively, you can type ‘ALL’ in upper or lower case
under the relevant heading. Similarly, you can type ‘OFF’ to
turn off the tracing for a particular component under either
the ‘special’ or ‘standard’ heading.
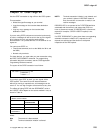
Table 9. The meanings of auxiliary trace status values
Auxiliary tracing
status
Auxiliary trace
flag
Auxiliary trace
data set
Started On Open
Paused Off Open
Stopped Off Closed
Copyright IBM Corp. 1982, 1999 221