


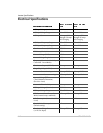
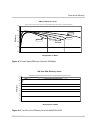

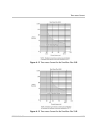

Power Versus Efficiency
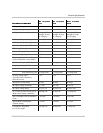
976-0043-01-02 A–9
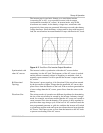
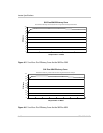
Figure A-4
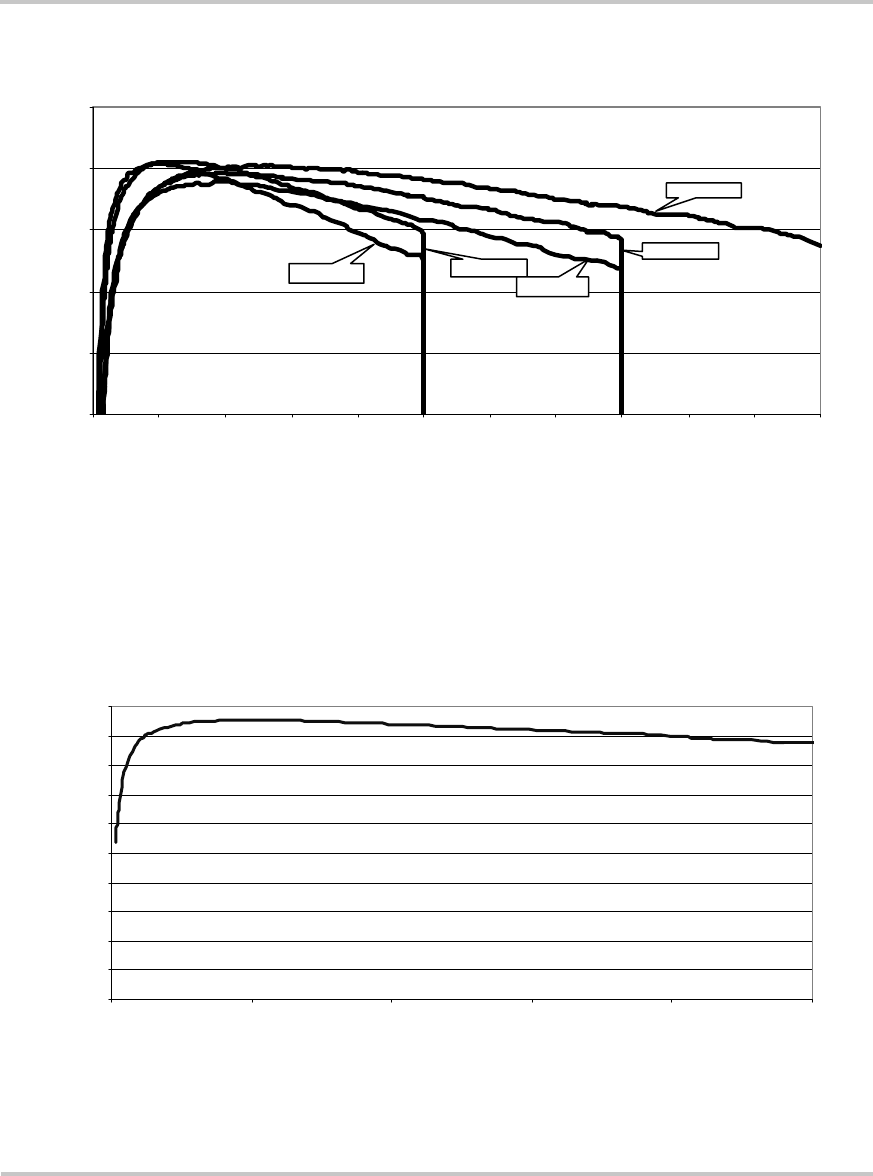
Sine Wave Plus Efficiency Curve for the SW Plus 2524
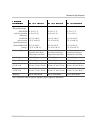
Figure A-3
Power Versus Efficiency Curves for All Models
SW Plus Efficiency Curves
75%
80%
85%
90%
95%
100 %
0 500 1000 1500 2000 2500 3000 3500 4000 4500 5000 5500
Output Power in Watts
Efficiency
Me asur ements made usi ng resist iv e load bank and Yokogawa WT2030 Digital Power Met er or Yok ogawa PZ4000 P ower
Analyzer
SW Plus 2524
SW Plus 5548
SW Plus 2548
SW Plus 4024
SW Plus 4048
SW Plus 2524 Efficiency Curve
0%
10%
20%
30%
40%
50%
60%
70%
80%
90%
10 0%
0 500 1000 1500 2000 2500
Output Power in Watts
Efficiency
Measurements made using resistive load bank and Yokogawa WT 2030 Digital Power Meter