


3-13
Making Time Domain Measurements
Time Domain Bandpass Mode
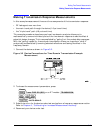
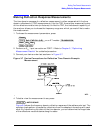
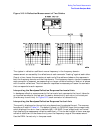
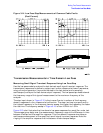
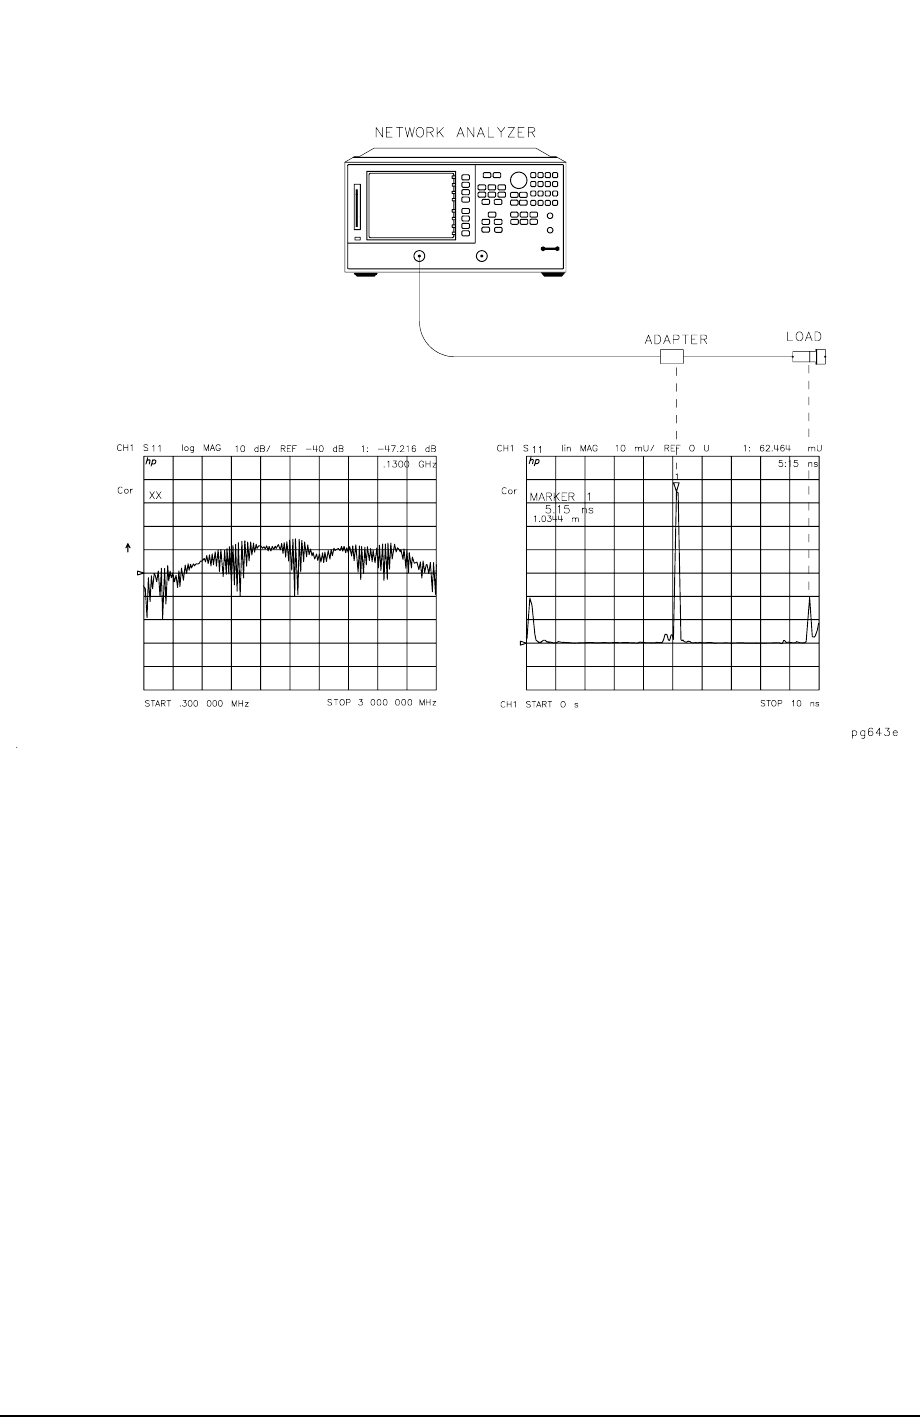
Figure 3-10 A Reflection Measurement of Two Cables
The ripples in reflection coefficient versus frequency in the frequency domain
measurement are caused by the reflections at each connector "beating" against each other.
One at a time, loosen the connectors at each end of the cable and observe the response in
both the frequency domain and the time domain. The frequency domain ripples increase as
each connector is loosened, corresponding to a larger reflection adding in and out of phase
with the other reflections. The time domain responses increase as you loosen the connector
that corresponds to each response.
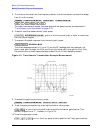
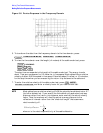
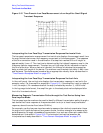
Interpreting the Bandpass Reflection Response Horizontal Axis
In bandpass reflection measurements, the horizontal axis represents the time it takes for
an impulse launched at the test port to reach a discontinuity and return to the test port
(the two-way travel time). In Figure 3-10, each connector is a discontinuity.
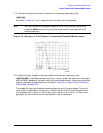
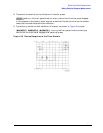
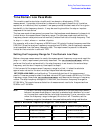
Interpreting the Bandpass Reflection Response Vertical Axis
The quantity displayed on the vertical axis depends on the selected format. The common
formats are listed in Table 3-1. The default format is LOG MAG (logarithmic magnitude),
which displays the return loss in decibels (dB). LIN MAG (linear magnitude) is a format
that displays the response as reflection coefficient ρ. This can be thought of as an average
reflection coefficient of the discontinuity over the frequency range of the measurement.
Use the REAL format only in low pass mode.