


7-8
Operating Concepts
Processing
Transform (Option 010 Only)
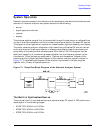
This transform converts frequency domain information into the time domain when it is
activated. The results resemble time domain reflectometry (TDR) or impulse-response
measurements. The transform uses the chirp-Z inverse fast Fourier transform (FFT)
algorithm to accomplish the conversion. The windowing operation, if enabled, is performed
on the frequency domain data just before the transform. (A special transform mode is
available to "demodulate" CW sweep data, with time as the stimulus parameter, and
display spectral information with frequency as the stimulus parameter.)
Format
This operation converts the complex number pairs into a scalar representation for display,
according to the selected format. This includes group delay calculations. These formats are
often easier to interpret than the complex number representation. (Polar and Smith chart
formats are not affected by the scalar formatting.) It is impossible to recover the complex
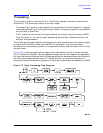
data after formatting, as shown in Figure 7-2.
Smoothing
This noise reduction technique smoothes noise on the trace. Smoothing is also used to set
the aperture for group delay measurements.
When smoothing is on, each point in a sweep is replaced by the moving average value of
several adjacent (formatted) points. The number of points included depends on the
smoothing aperture, which can be selected by the user. The effect is similar to video
filtering. If data and memory are displayed, smoothing is performed on the memory trace
only if smoothing was on when data was stored into memory.
Format Arrays
The data processing results are now stored in the format arrays. Notice that the marker
values and marker functions are all derived from the format arrays in Figure 7-2. Limit
testing is also performed on the formatted data. The format arrays are accessible via GPIB.
Offset and Scale
These operations prepare the formatted data for display. This is where the reference line
position, reference line value, and scale calculations are performed, as appropriate to the
format.
Display Memory
The display memory stores the display image for presentation on the analyzer. The
information stored includes graticules, annotation, and softkey labels. If user display
graphics are written, these are also stored in display memory. When a print or plot is
made, the information is taken from display memory.
The display is updated frequently and synchronously with the data processing operations.