


3-23
Making Time Domain Measurements
Transforming CW Time Measurements into the Frequency Domain
Interpreting the Forward Transform Horizontal Axis
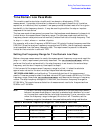
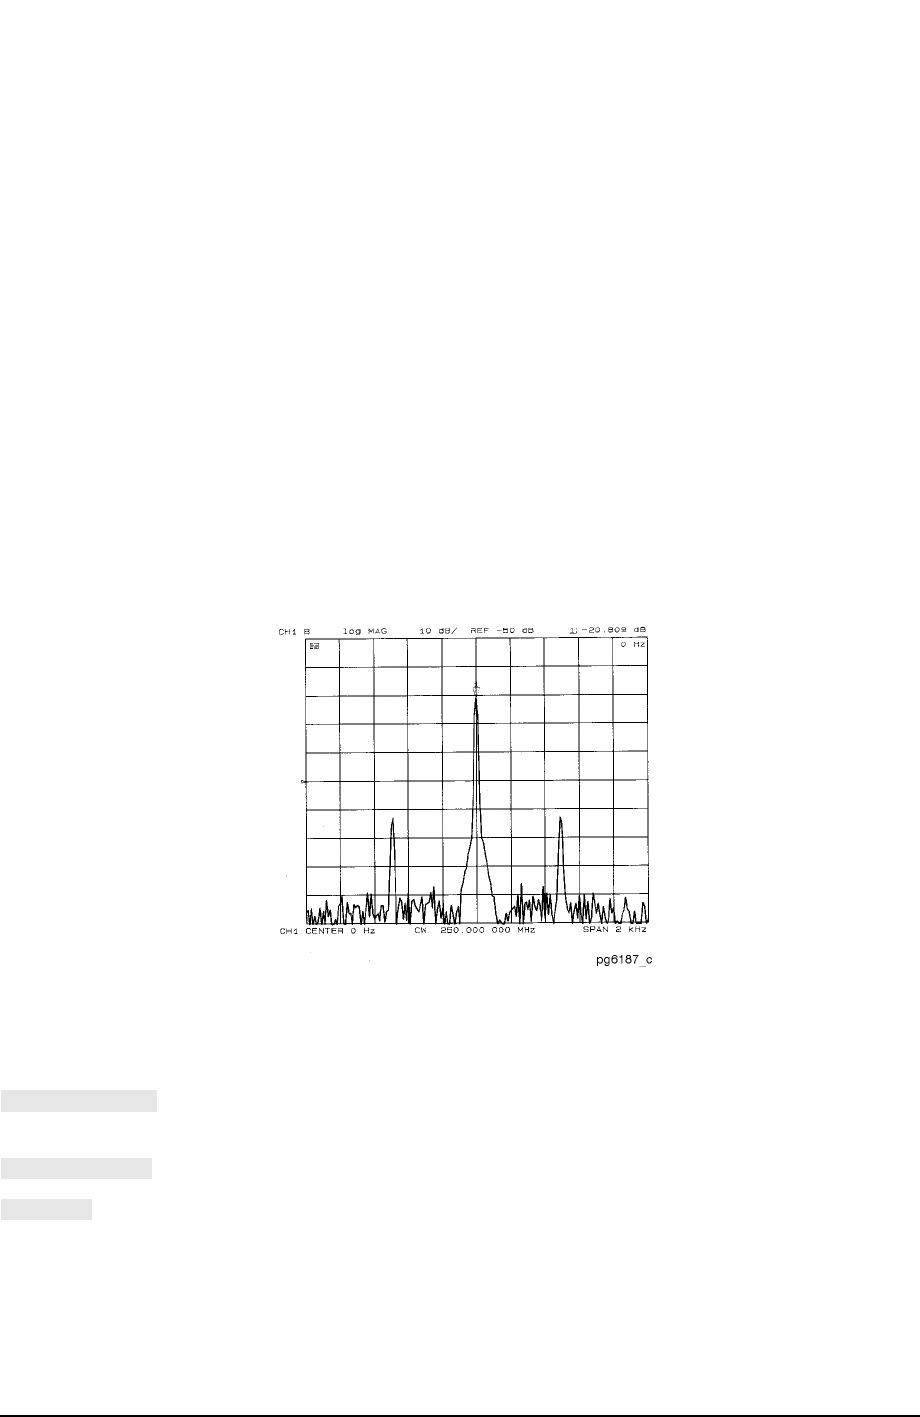
In a frequency domain transform of a CW time measurement, the horizontal axis is
measured in units of frequency. The center frequency is the offset of the CW frequency. For
example, with a center frequency of 0 Hz, the CW frequency (250 MHz in the example) is in
the center of the display. If the center frequency entered is a positive value, the CW
frequency shifts to the right half of the display; a negative value shifts it to the left half of
the display. The span value entered with the transform on is the total frequency span
shown on the display. (Alternatively, the frequency display values can be entered as start
and stop.)
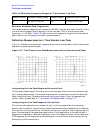
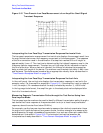
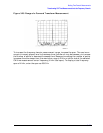
Demodulating the Results of the Forward Transform
The forward transform can separate the effects of the CW frequency modulation amplitude
and phase components. For example, if a test device modulates the transmission response
(S
21
) with a 500 Hz AM signal, you can see the effects of that modulation as shown in
Figure 3-18. To simulate this effect, apply a 500 Hz sine wave to the analyzer rear panel
EXT AM input.
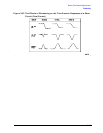
Figure 3-18 Combined Effects of Amplitude and Phase Modulation
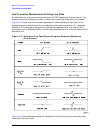
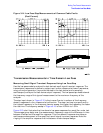
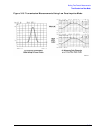
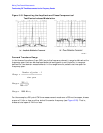
Using the demodulation capabilities of the analyzer, it is possible to view the amplitude or
the phase component of the modulation separately. The window menu includes the
following softkeys to control the demodulation feature:
is the normal preset state, in which both the amplitude and phase
components of any test device modulation appear on the display.
displays only the amplitude modulation, as illustrated in Figure 3-19a.
displays only the phase modulation, as shown in Figure 3-19b.
DEMOD: OFF
AMPLITUDE
PHASE