45
Monitoring Inverter Status [Monitor]
2
FUNCTIONS
2.8.3 Monitoring by waveform [Oscilloscopes]
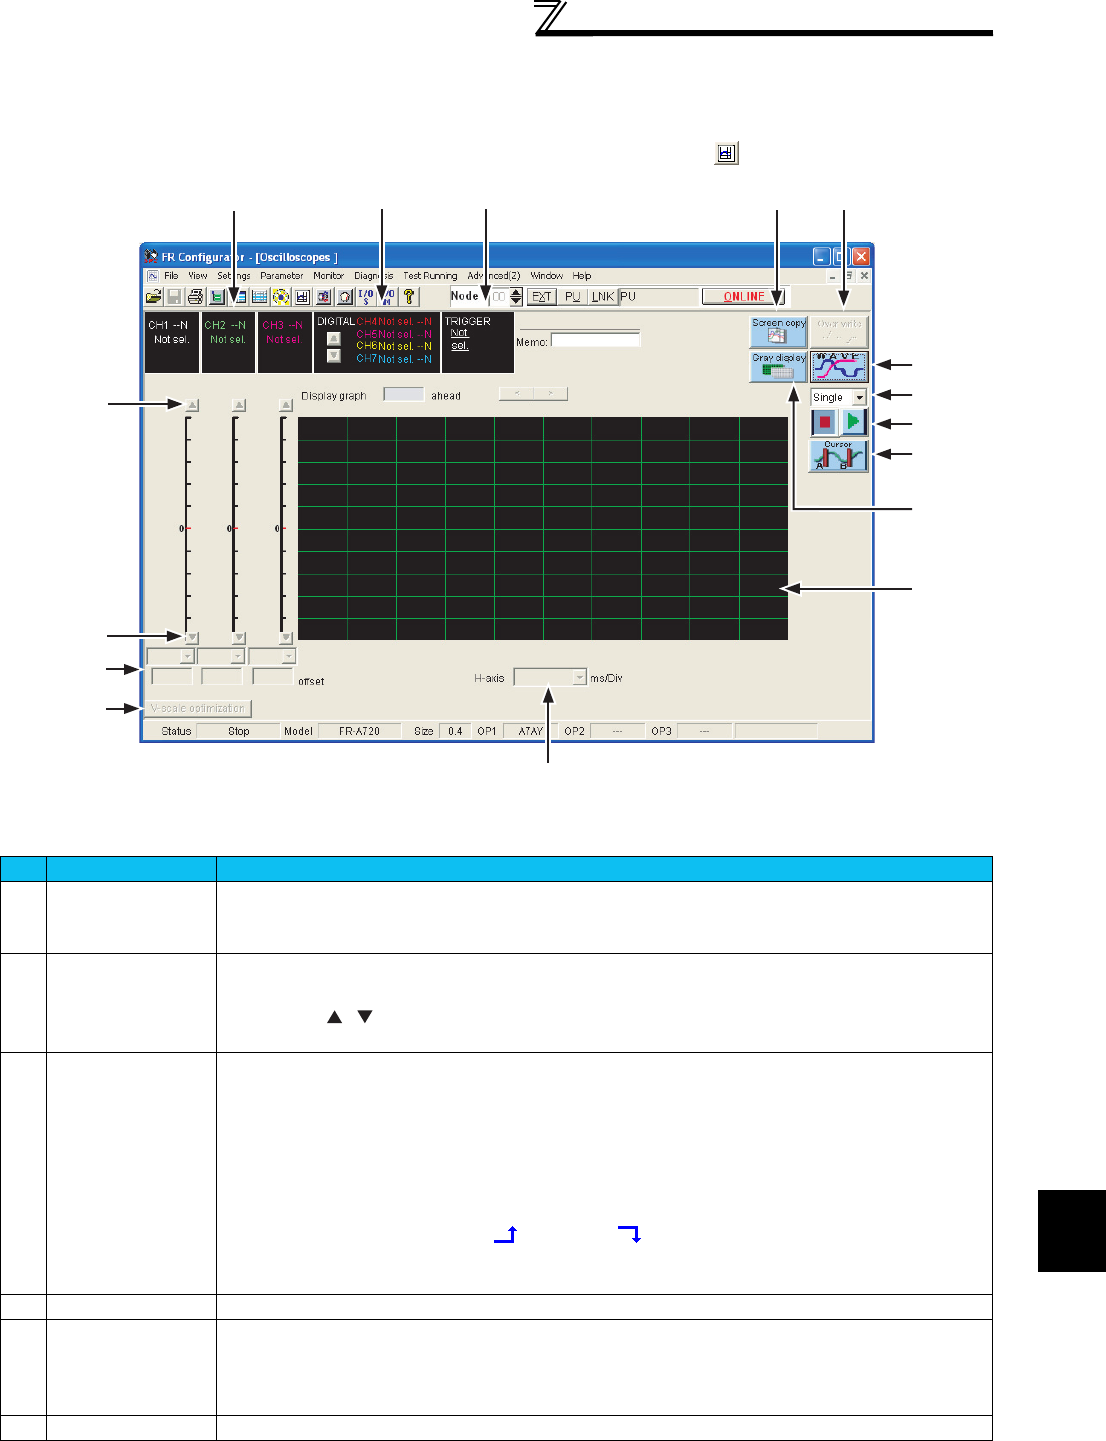
Various signals such as output frequency or output current can be monitored by waveform like an oscilloscope.
Selecting the [Oscilloscopes] command in the [Monitor] menu or selecting the tool button shows the following screen.
No. Name Function and description
A
Analog data display Displays the station number set on the measurement conditions screen and the name of analog data.
Up to three signals from CH1 to CH3 can be displayed.
Can be read from the saved data (gpi files).
B
Digital data display Displays the station number set on the measurement conditions screen and the name of digital data.
Up to 4 signals from CH4 to CH7 can be displayed.
Move button ( / ) moves the graph display position.
The saved data (gpi files) can also be read.
C
Trigger data display • Trigger source display:
Displays CH set on the measurement conditions screen when inside trigger is selected. Displays “Alarm”
when the alarm trigger is selected.
The initial status displays “Not sel.” since “No trigger” is selected.
• Display of trigger level:
When the analog data (CH1 to CH3) are selected by the inside trigger on the measurement condition
screen, the set startup/shutdown level is displayed.
• Display of trigger condition startup ( ) /shutdown ( ):
When the inside trigger is selected on the measurement condition screen, the set trigger condition
(startup/shutdown) is displayed.
D
Screen copy
Copies the graph picture on the clipboard to paste to other applications.
E
Overwriting Overwriting can be performed during sampling stop.
When the past history display switching is executed, the waveform data of the selected history turns into the
selected color and the already displayed waveform data the gray line.
Overwriting can be performed 8 times including waveform data.
F
WAVE
Sets the measurement conditions. (Refer to measurement condition setting, page 47.)
ABC D
E
F
G
H
I
J
K
L
M
N
O
O


