65
Advanced Function
2
FUNCTIONS
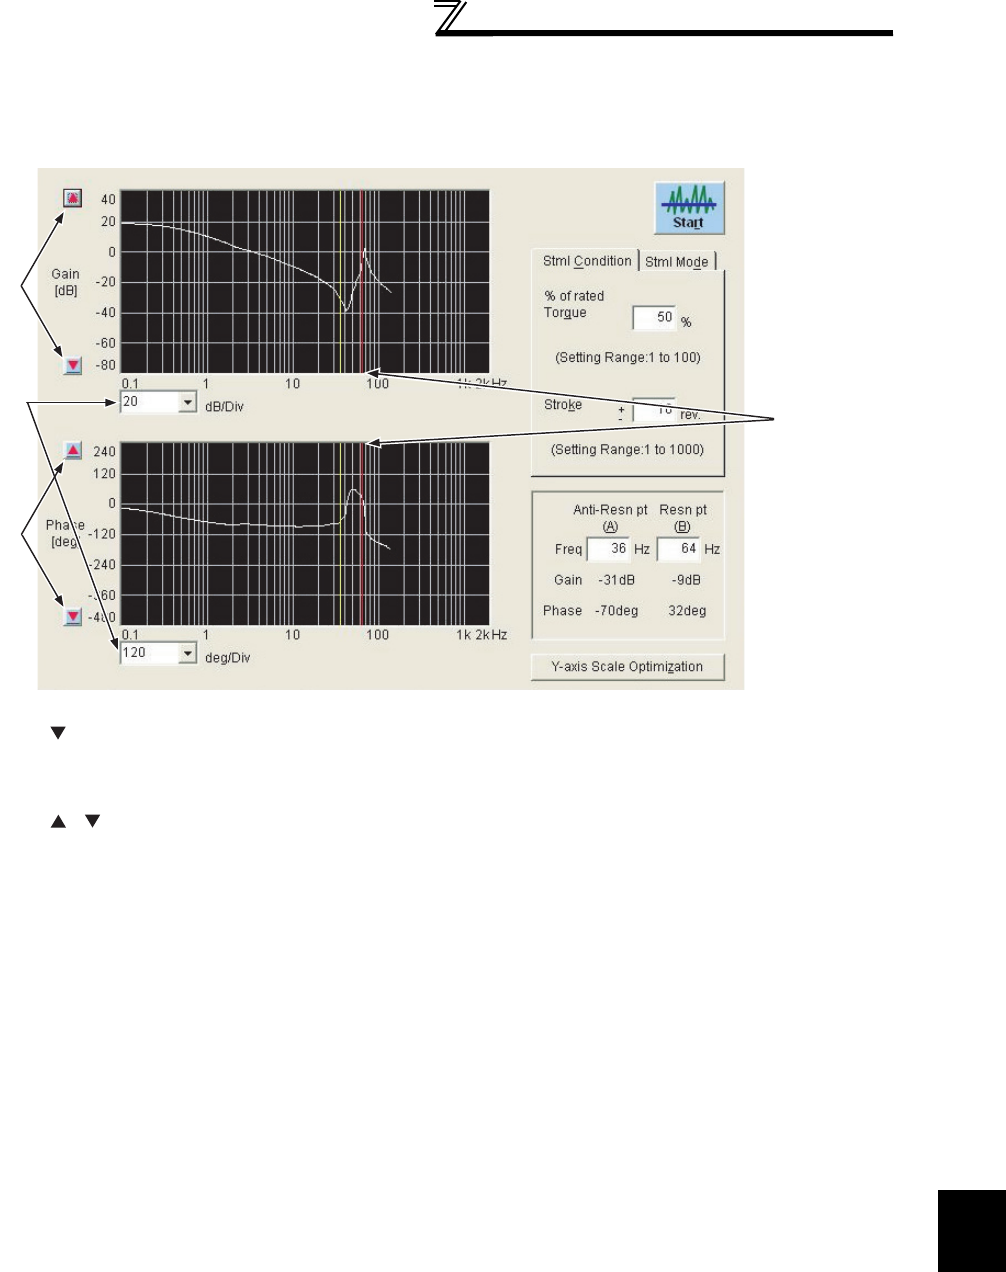
(7) The frequency characteristics measured by Machine analyzer are displayed in Bode diagram.
For the waveform data, you can change the vertical axis scale and/or move the resonance point and anti-resonance
point cursors.
1) Setting of the vertical axis scale
Click the [ ] to display the drop-down list.
The unit of the vertical axis scale can be selected from the list.
Click the " Y-axis scale optimization" button to automatically change the scale to put the waveform within the screen.
2) Moving the position of zero in the vertical axis
Click the [ ]/[ ] button to move the position of zero.
3) Resonance point, anti-resonance point cursors
The resonance point (red cursor) and anti-resonance point (yellow cursor) are normally detected automatically , but
depending on the characteristic, they may not be detected automatically.
In such a case, move the cursors to the normal positions by directly writing the resonance point and anti-resonance
point frequency.
1)
3)
2)
2)


