124 COMMANDCENTER NOC ADMINISTRATOR GUIDE
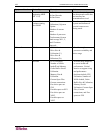
Cisco Network gear CPU Utilization
Free Memory
Buffer failures
Buffer memory
allocation failures
Provides insight as to
router sizing and
performance,
especially as
augmented by MIB2 data.
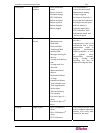
Bay/Wellfleet Routers/Switches Total kernel tasks
Total kernel tasks in
queue
Free memory
Free buffers
Provides key sizing
data, especially in
concerning the system
demands to CPU
capabilities
comparison
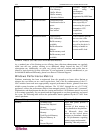
3Com Routers/Switches Total memory
CPU Utilization
Buffer memory
available
Buffer allocation
failures
Buffer memory total
Buffer memory total
available
These statistics provide
an overview of the
device’s performance,
as well as the device’s
ability to handle its
current traffic load
SNMP Data Collection Enhancements
As a standard part of the Raritan service offering, data collection enhancements are regularly
rolled into the core product offering at no additional charge beyond the base CC-NOC
subscription rate. Additionally, we work very closely with our customer and reseller base to
identify a logical priority for new collections. If your equipment is currently unaddressed, or you
feel should be addressed differently, please let us know at Technical Support.
Windows Performance Metrics
Windows monitoring has been re-engineered from the ground-up to better allow Raritan to
enhance the core feature set on a more regular basis. One of the key enhancements of the CC-
NOC includes better and more appropriately targeted performance metrics, gleaned from more
reliable system locations on differing platforms. The CC-NOC, through the use of CC-NOC
appliances, collects the performance metrics from managed systems, 25 Servers and 5 “promoted”
Workstations, and then presents the data for viewing and archival. All Windows metrics are saved
in five-minute granularity for one month and then aggregated to one-hour granularity and stored
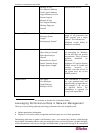
for a year. The following table reflects the performance metrics gathered by the CC-NOC from
various platforms.
Measured Component Metric Relevance & Notes
Memory Available bytes
Percent Free Physical
Memory
Percent Free Logical
Memory
Total Physical Memory
Physical Memory In
Use
Percent Physical
These data points provide a
collective
overview of how memory is
being handled on the platform.
Per Microsoft, these data
points are the critical pieces
necessary to formulate a stance
on OS performance regarding
memory usage and potential
“thrashing” that may occur on


