APPENDIX C: PERFORMANCE MONITORING 125
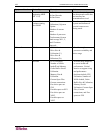
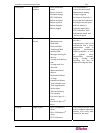
Memory In Use
Free Physical Memory
Total Logical Memory
Logical Memory In Use
Percent Logical
Memory In Use
Free Logical Memory
Memory Pages per
Second
1
underpowered devices.
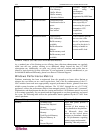
Processor (CPU) Total Processor Time
Processor Queue
Length
1
Interrupts per Second
1
Microsoft summarizes the
usage of all processors (for
SMP systems) into a single
statistic. This indicates the
Platforms overall ability to
handle the workload.
Network Network Utilization
1
Bytes Sent per Second
1
Bytes Received per
Second
1
Packet Receive Errors
1
Packet Transmit Errors
1
Output Queue Length
1
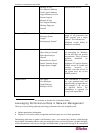
Microsoft’s implementation
of networking for Windows
98 and ME does not provide
any statistics. This is a known
problem identified by
Microsoft.
Windows NT requires that the
SNMP service be loaded and
running, however, we
interface with that service at
the system level, not via the
SNMP protocol.
Logical Drives Free Space
Free Kilobytes
Total Kilobytes
Kilobytes In Use
This information is reported
on a per partition basis, and
maps directly to logical drives
(for example, C:, D:, E:), not
to physical drives. The
information is reported for
every local logical drive.
1 Not available on Windows 98 or Millenium Edition
Leveraging Performance Data in Network Management
The keys to successfully gathering and using performance data are straightforward:
• Gather appropriate information
• Display it so it can be readily recognized and acted upon Act on it when appropriate
Determining what data to gather with Raritan is easy—our experts have already culled through
the available information and are only presenting the pieces you need. Raritan’s graphical display
of this information is also easy to navigate and understand, yet powerful enough to be customized


