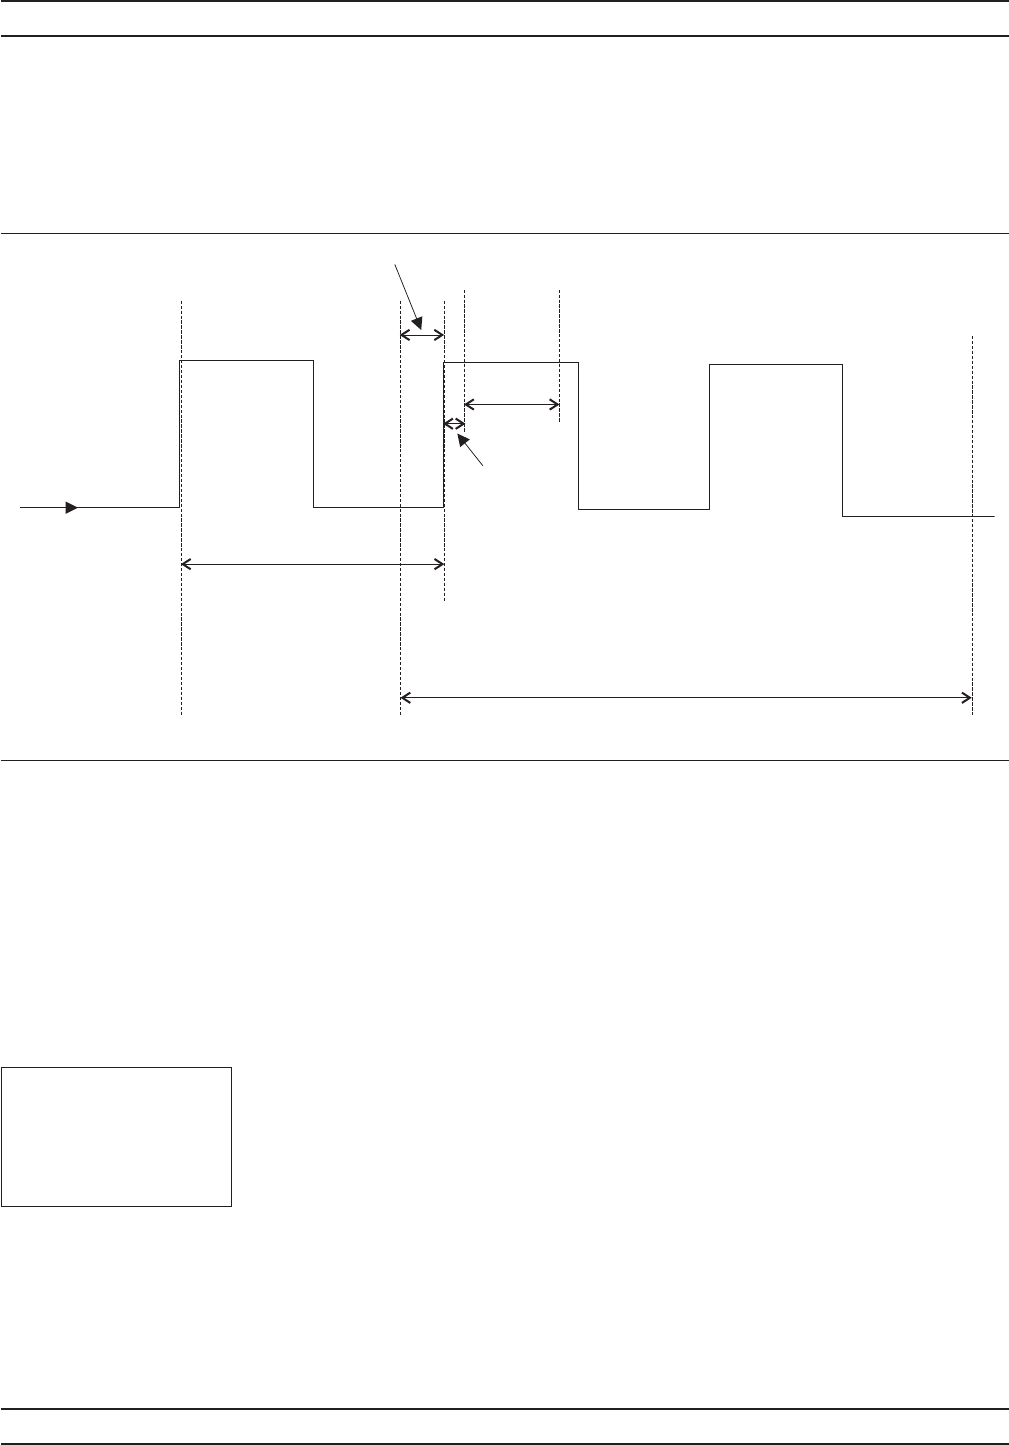
Figure 4-4 shows a typical trigger timing diagram. Note that the display
trigger delay is only present when in Profile operation mode, and helps in
setting the ‘window’ position along the signal.
The Data Collection Time (collection period) is only present when in Pro
-
file operation mode (System|Profile|PERIOD), and is the period of time
displayed on the profile graph.
The Gate Width is the section of the signal in which the measurements
are performed. In Profile mode, this is the time between Cursor 1 and Cur
-
sor 2 and is used to provide the Between Cursor Average measurement.
Display Trigger Delay (System|Profile|DELAY) is the delay after the trigger
point.
The Pretrigger % (System|Graphics|PRE TRG%) is only used in the Pro
-
file mode, and shows a percentage of the data collection time as Pretrig
-
ger information. If the display trigger delay is less than the pretrigger delay
period, there will be no Pretrigger information as it will be before the trig
-
ger point itself.
Setting the display trigger delay to the length of the data pulse causes a
trigger on the first pulse, but displays the second pulse with valid “pretrig
-
ger information.” This is the best method for repetitive signals and can be
used to verify signal repetition intervals.
4-20 ML2430A OM
TRIGGER MENU OPERATION
NOTE
External trigger is only
effective at 800 KHz or
lower.
INCOMING SIGNAL
FROM SENSOR
TRIGGER POINT
DATA COLLECTION TIME
(PROFILE MODE)
DISPLAY TRIGGER DELAY
(PROFILE MODE)
GATE
WIDTH
DELAY
PRETRIGGER %
CURSOR
1
CURSOR
2
Figure 4-4. Sample Trigger in Graphic Mode


