


20060301
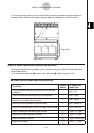
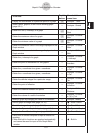
To do this:
Tap this
button:
Or select this
menu item:
Display the coordinates at a particular point on a graph
=
Analysis - Trace
Insert a point, graphic, or text into an existing graph
(page 3-6-1)
— Analysis - Sketch
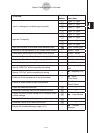
Obtain the root (
x
-intercept) of a graph
Y
Analysis - G-Solve -
Root
Obtain the maximum value of a graph
U
Analysis - G-Solve -
Max
Obtain the minimum value of a graph
I
Analysis - G-Solve -
Min
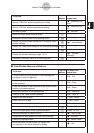
Obtain the maximum value in the range displayed on the
Graph window
—
Analysis - G-Solve -
fMax
Obtain the minimum value in the range displayed on the
Graph window
—
Analysis - G-Solve -
fMin
Obtain the
y
-intercept of a graph —
Analysis - G-Solve -
y
-Intercept
Obtain the point of intersection for two graphs —
Analysis - G-Solve -
Intersect
Obtain the
y
-coordinate for a given
x
-coordinate —
Analysis - G-Solve -
y
-Cal
Obtain the
x
-coordinate for a given
y
-coordinate —
Analysis - G-Solve -
x
-Cal
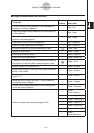
Obtain the definite integral for a particular range —
Analysis - G-Solve -
∫
d
x
Obtain the point of inflection —
Analysis - G-Solve -
Inflection
Obtain the distance between two points —
Analysis - G-Solve -
Distance
Obtain the volume of a solid of revolution —
Analysis - G-Solve -
π ∫
(f (
x
))
2
d
x
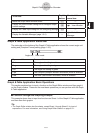
Modify a graph by changing the value of a coefficient — Analysis - Modify
Save a graph as image data (page 3-2-10) —
a
- Store Picture
Recall the image of a graph (page 3-2-10) —
a
- Recall Picture
Display the Dynamic Graph dialog box (page 3-5-4) —
a
- Dynamic Graph
Display the Draw Shade dialog box (page 3-3-12) —
a
- Draw Shade
Use a built-in function template to input a function for
graphing
• Note that built-in functions are graphed automatically
and cannot be used for input on the Graph Editor
window.
—
a
- Built-In
3-1-5
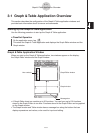
Graph & Table Application Overview