


20060301
u
Specifying all
x
-values
This method generates a reference table by looking up data stored in a list. A LIST variable is
used to specify the
x
-values. When using this method, it is up to you specify all of the correct
x
-values required to generate the summary table. The summary table will not be generated
correctly if you provide incorrect
x
-values.
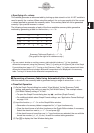
The following shows examples of each of the three available summary table generation
methods by generating a table for the function
y
=
x
3
– 3
x
.
3-4-10
Using Table & Graph
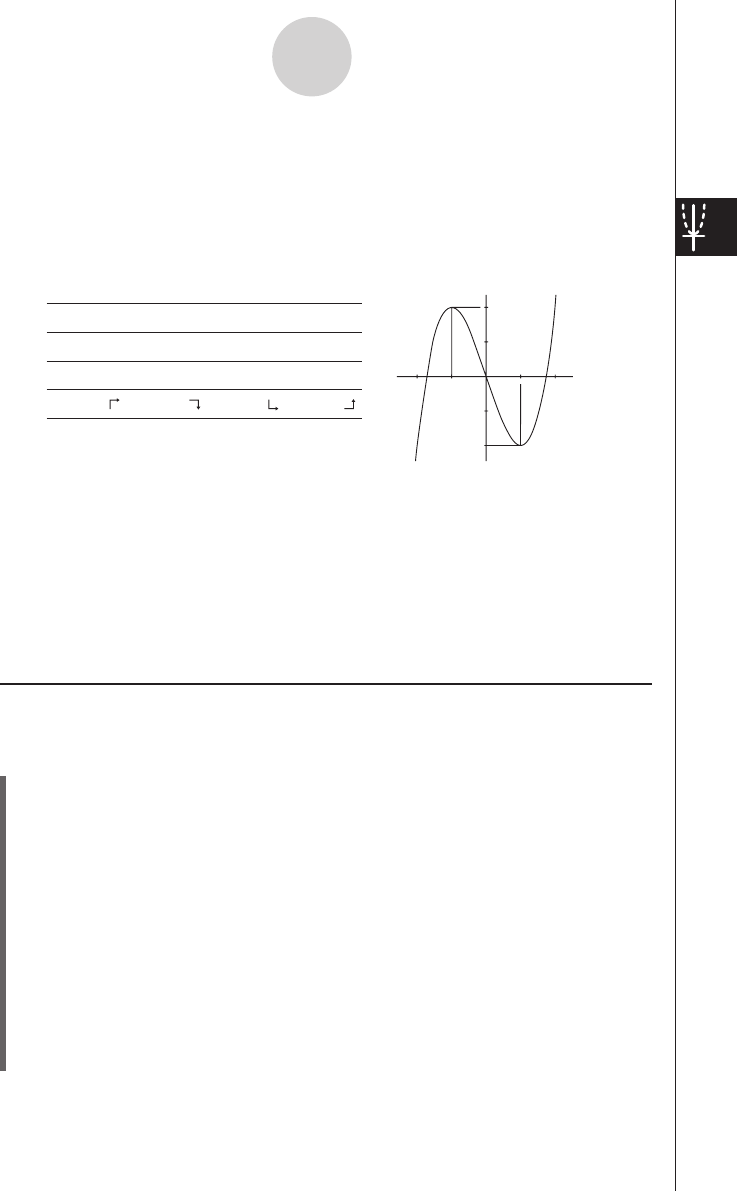
x
–1 0 1
f
(
x
) + 0 – –3 – 0 +
f
(
x
) – –6 – 0 + 6 +
f
(
x
) 2 0 –2
Tip
• You can control whether or not the summary table should include an
f
(
x
) line (quadratic
differential component) using the [Summary Table
f
(
x
)] setting on the [Special] tab of the Graph
Format dialog box (page 1-9-7). Turning on the [Summary Table
f
(
x
)] option causes both linear
differential components and quadratic differential components to be displayed in the summary
table. Turning it off shows linear differential components only.
k
Generating a Summary Table Using Automatically Set
x
-Values
With this method, the summary table is generated using a range of values from –
∞
to
∞
.
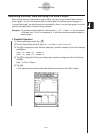
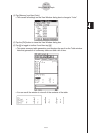
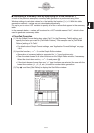
u
ClassPad Operation
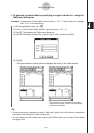
(1) On the Graph Format dialog box, select “View Window” for the [Summary Table]
setting, and specify the value you want for [Cell Width Pattern]. This example uses a
[Cell Width Pattern] setting of “4 Cells”.
• To open the Graph Format dialog box, tap
O
, and then [Graph Format].
• For additional details about Graph Format settings, see “Application Format Settings”
on page 1-9-4.
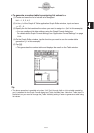
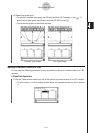
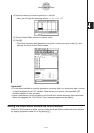
(2) Input the function
y
=
x
3
– 3
x
on the Graph Editor window.
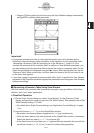
• Generation of summary tables is supported for “
y
=” type functions only.
• Clear the check boxes of all other functions on the Graph Editor window, if necessary.
Select the check box next to
y
=
x
3
– 3
x
and press
E
.
• If the check boxes of more than one “
y
=” type functions are selected, the one with the
lowest line number (
y
1,
y
2,
y
3, etc.) is used for number table generation.
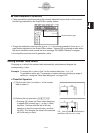
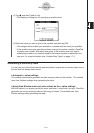
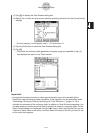
(3) Tap
6
to display the View Window dialog box.
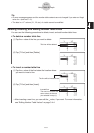
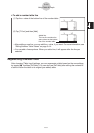
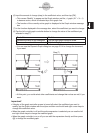
Summary Table and Graph of
y
=
x
3
– 3
x
(The graph to the right is for reference only.)
2
1
–2
–1
–2
–1
1
2