


20060301
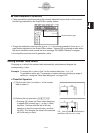
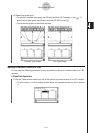
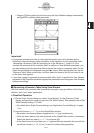
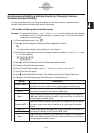
• Tapping
$
here graphs the function using the View Window settings automatically
configured for summary table generation.
3-4-12
Using Table & Graph
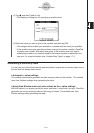
Important!
• A monotone increasing function or other special function may not be solvable by the
ClassPad’s internal summary table calculation. If this happens, use the procedure under
“Generating a Summary Table by Specifying All of the Values for
x
” (page 3-4-14) to
calculate the elements of the summary table. In addition to View Window parameters, you
can also select previously stored list data to specify the range of a summary table. On the
Graph Format dialog box (displayed using the
O
menu), select the [Special] tab, tap the
“Summary Table” down arrow button, and then select the name of the list you want to use
on the menu that appears.
• If you draw a graph or generate a summary table while “Auto” is specified for View Window
parameters, the ClassPad calculates appropriate parameters and configures View Window
settings accordingly.
k
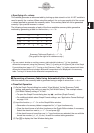
Generating a Summary Table Using View Window
With this method, the summary table is generated using the range you define for the View
Window “xmin” and “xmax” parameters.
u
ClassPad Operation
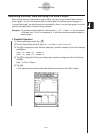
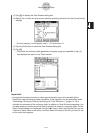
(1) On the Graph Format dialog box, select “View Window” for the [Summary Table]
setting, and specify the value you want for [Cell Width Pattern]. This example uses a [Cell
Width Pattern] setting of “4 Cells”.
• For details about Graph Format settings, see “Application Format Settings” on page
1-9-4.
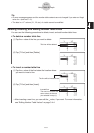
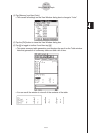
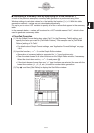
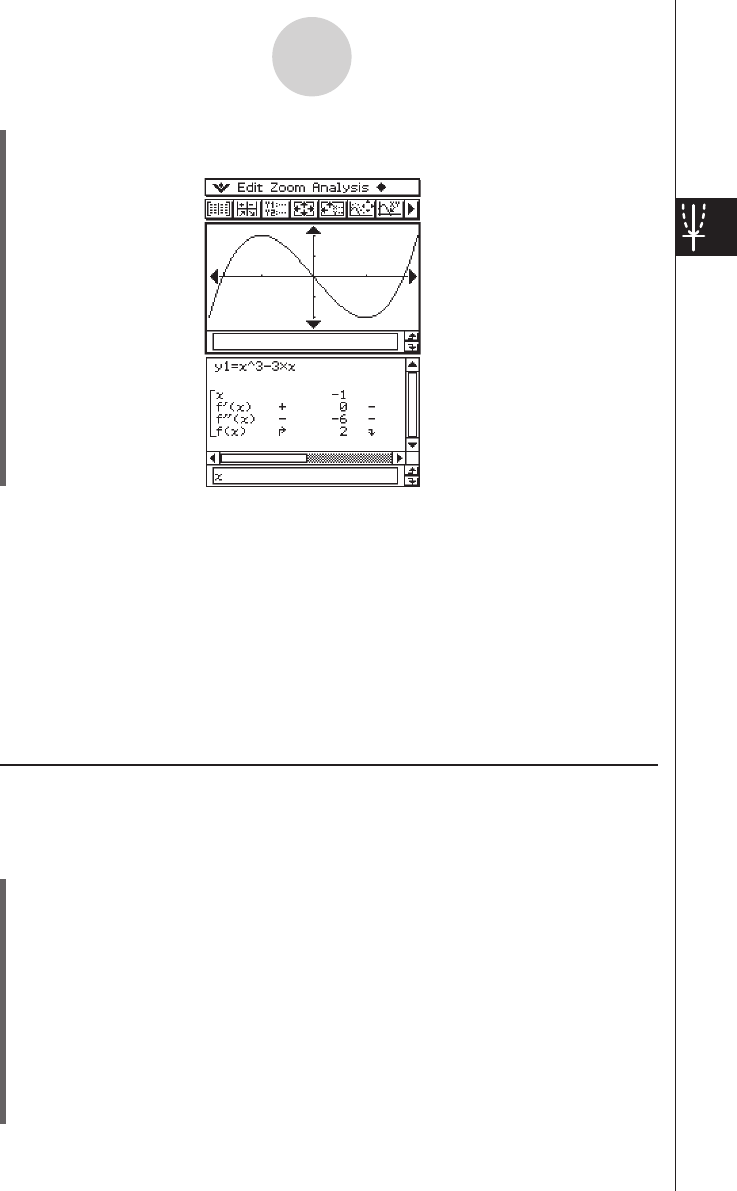
(2) Input the function
y
=
x
3
– 3
x
on the Graph Editor window.
• Generation of summary tables is supported for “
y
=” type functions only.
• Clear the check boxes of all other functions on the Graph Editor window, if necessary.
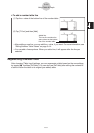
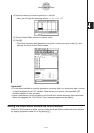
Select the check box next to
y
=
x
3
– 3
x
and press
E
.
• If the check boxes of more than one “
y
=” type functions are selected, the one with the
lowest line number (
y
1,
y
2,
y
3, etc.) is used for number table generation.