


20060301
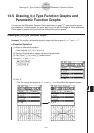
14-6-3
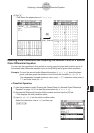
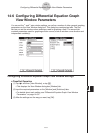
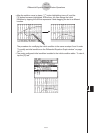
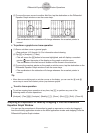
Configuring Differential Equation Graph View Window Parameters
k
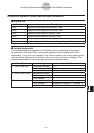
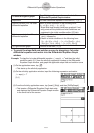
Solutions Tab
Setting Description
Solution Dir.
A solution curve is graphed starting at the initial condition value
t
0 and
continues until it reaches a target value, which can be either
t
min or
t
max. The solution direction determines the target values. Forward will
graph the solution from
t
0 to
t
max. Backward will graph the solution
from
t
0 to
t
min. Both will graph the solution from
t
0 to
t
min, and then
t
0
to
t
max.
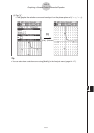
Independent Assignment of the independent variable for differential equations. The
possible values are
x
or
t
. If you are graphing a phase plane you cannot
choose the independent variable. It will automatically be set to
t.
t
0 (or
x
0) If the independent variable is different from the
x
-axis variable then you
can enter the initial value for the independent variable, unless you are
graphing a slope field.
t
min (or
x
min) If the independent variable is different from the
x
-axis variable then you
can enter the minimum value for the independent variable.
t
max (or
x
max) If the independent variable is different from the
x
-axis variable then you
can enter the maximum value for the independent variable.
x
-Axis Assignment for the (horizontal)
x
-axis. If you are graphing a slope field
or phase plane you will not be able to choose the
x
-axis variable but it
will still be displayed in this dialog box.
y
-Axis Assignment for the (vertical)
y
-axis. If you are graphing a slope field or
phase plane you will not be able to choose the
y
-axis variable but it will
still be displayed in this dialog box.