20060301
3-5-2
Modifying a Graph
To do this:
Tap the right graph controller arrow.
Tap the left graph controller arrow.
Do this:
Decrease the value of the coefficient
Increase the value of the coefficient
• You can use the Dynamic Graph dialog box on page 3-5-4 to change the increment,
if you want.
(6) Input the amount of change (step) in the coefficient value, and then tap [OK].
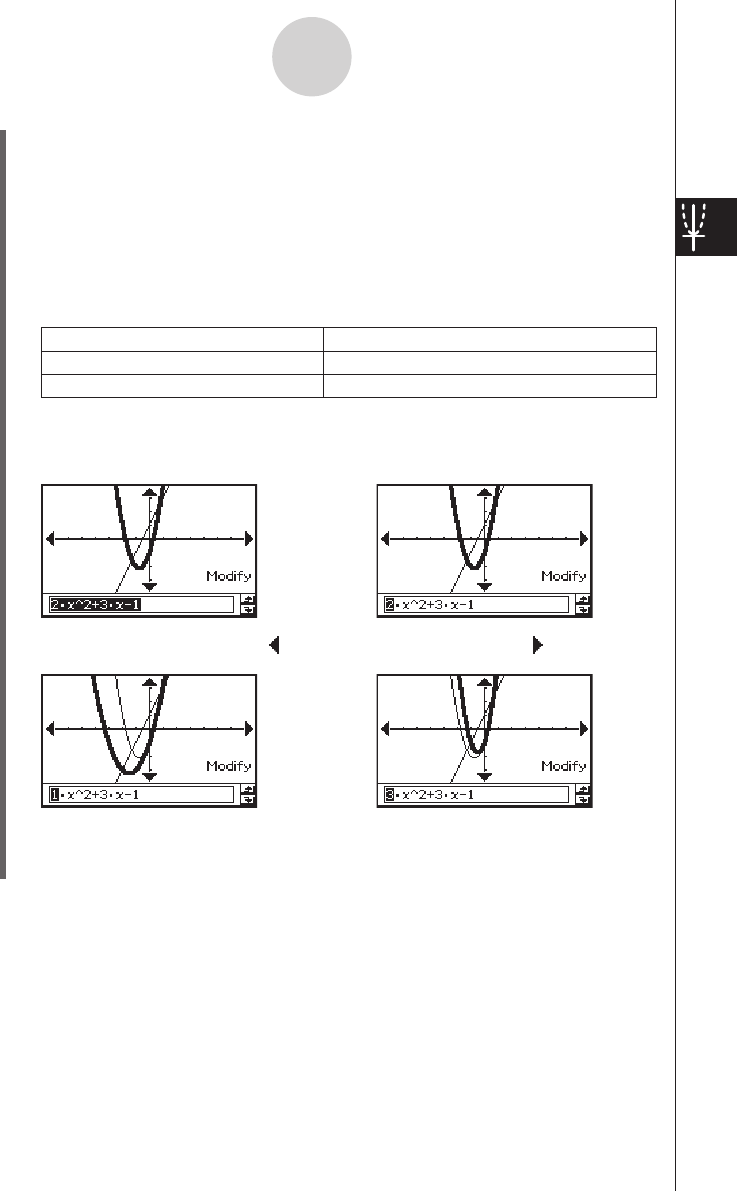
• This causes “Modify” to appear on the Graph window and the
y
1 graph (2
x
2
+ 3
x
–1)
to become active, which is indicated by a thick graph line.
• The function of the currently active graph is displayed in the Graph window message
box.
(7) In the function displayed in the message box, select the coefficient you want to change.
(8) Tap the left or right graph controller button to change the value of the coefficient you
selected in step (7).
• At this point, you could select other coefficients and change their values as well, if you
want.
Important!
• If display of the graph controller arrows is turned off,select the coefficient you want to
modify, tap the Graph window with the stylus and then use the left and right cursor keys to
change the coefficient value.
• When the graph controller is off and the entire expression is selected you can use the left
and right cursor keys to change the modified graph.
• When the graph controller is on or off you can edit the expression directly and then press
E
to change the modified graph.
Step (7)
Tap
.
Tap
.
e
e
e


