A.3 Status Panel
This section explains the different statuses that are displayed in the ROR console.
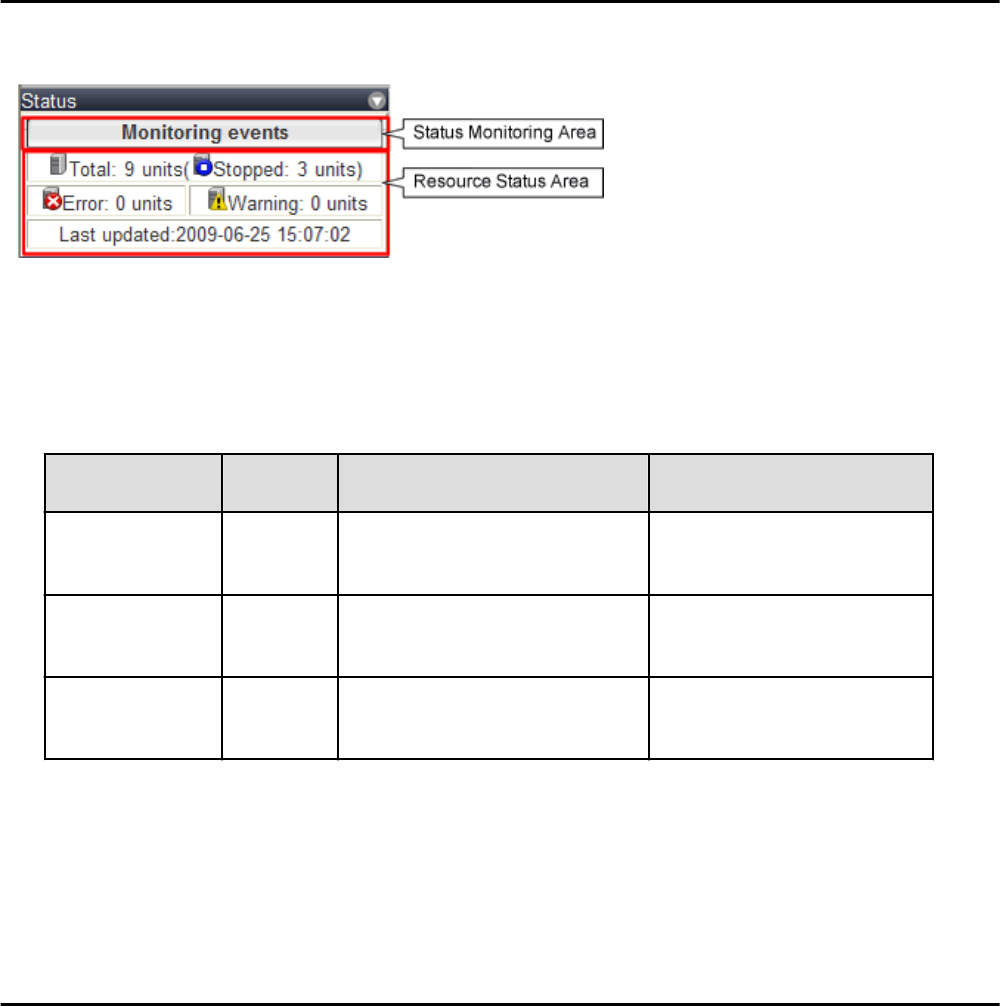
Figure A.3 Status Panel
Status Monitoring Area
The Event Log monitors a history of events that have occurred on managed resources.
Based on detected events, the status monitoring area will change color and blink. Clicking the status monitoring area will stop the
blinking.
The following table details the different statuses and their associated corrective actions.
Table A.16 Monitor Status List
Monitoring Status
Background
Color
Details Corrective action
Monitoring events Grey
This indicates a normal state.
No warning or error-level events have
occurred on the displayed resources.
No action is necessary.
Warning event
detected
Yellow
This indicates a warning state.
A warning-level event has occurred on
one or more of the displayed resources.
Click the status monitoring area to
stop the blinking and fix the cause of
the problem.
Error event detected Red
This indicates an error state.
An error-level event has occurred on one
or more of the displayed resources.
Click the status monitoring area to
stop the blinking and fix the cause of
the problem.
Resource Status Area
This area displays the number of registered servers experiencing each status.
The resource status area lights up when there is at least one server in either "Error" or "Warning" status.
Clicking a lit up status area will display a list of resources with that status in the [Resource List] tab. Double-click a displayed resource
to switch to its [Resource Details] tab and open either its external management software or the Management Blade's Web interface to
investigate the problem.
A.4 Tree Panel
This section describes the trees used in the ROR console.
- 164 -


