


Chapter 10 Monitor
ISG50 User’s Guide
197
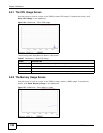
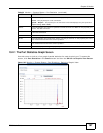
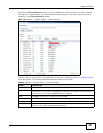
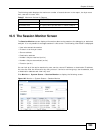
10.2.1 The Port Statistics Graph Screen
Use this screen to look at a line graph of packet statistics for each physical port. To access this
screen, click Port Statistics in the Status screen and then the Switch to Graphic View Button.
Figure 143 Monitor > System Status > Port Statistics > Switch to Graphic View
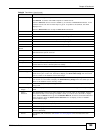
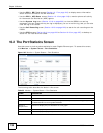
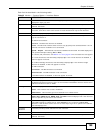
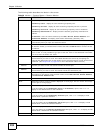
Status This field displays the current status of the physical port.
Down - The physical port is not connected.
Speed / Duplex - The physical port is connected. This field displays the port speed and
duplex setting (Full or Half).
TxPkts This field displays the number of packets transmitted from the ISG50 on the physical port
since it was last connected.
RxPkts This field displays the number of packets received by the ISG50 on the physical port since
it was last connected.
Collisions This field displays the number of collisions on the physical port since it was last connected.
Tx B/s This field displays the transmission speed, in bytes per second, on the physical port in the
one-second interval before the screen updated.
Rx B/s This field displays the reception speed, in bytes per second, on the physical port in the
one-second interval before the screen updated.
Up Time This field displays how long the physical port has been connected.
Table 33 Monitor > System Status > Port Statistics (continued)
LABEL DESCRIPTION