


Chapter 10 Monitor
ISG50 User’s Guide
200
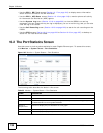
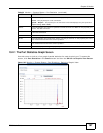
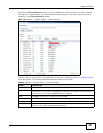
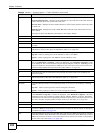
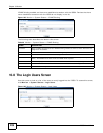
10.4 The Traffic Statistics Screen
Click Monitor > System Status > Traffic Statistics to display the Traffic Statistics screen. This
screen provides basic information about the following for example:
• Most-visited Web sites and the number of times each one was visited. This count may not be
accurate in some cases because the ISG50 counts HTTP GET packets. Please see Table 36 on
page 201 for more information.
• Most-used protocols or service ports and the amount of traffic on each one
• LAN IP with heaviest traffic and how much traffic has been sent to and from each one
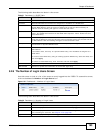
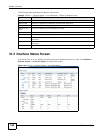
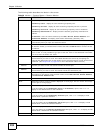
Name This field displays the name of each interface. If there is a Expand icon (plus-sign) next to
the name, click this to look at the statistics for virtual interfaces on top of this interface.
Status This field displays the current status of the interface.
Down - The interface is not connected.
Speed / Duplex - The interface is connected. This field displays the port speed and
duplex setting (Full or Half).
This field displays Connected and the accumulated connection time (hh:mm:ss) when the
PPP interface is connected.
TxPkts This field displays the number of packets transmitted from the ISG50 on the interface
since it was last connected.
RxPkts This field displays the number of packets received by the ISG50 on the interface since it
was last connected.
Tx B/s This field displays the transmission speed, in bytes per second, on the interface in the one-
second interval before the screen updated.
Rx B/s This field displays the reception speed, in bytes per second, on the interface in the one-
second interval before the screen updated.
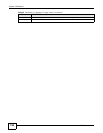
Table 35 Monitor > System Status > Interface Status (continued)
LABEL DESCRIPTION