


B – Graphing Port Performance
Displaying Graphs
59048-04 Rev. B B-7
D
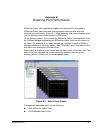
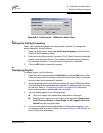
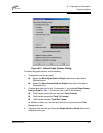
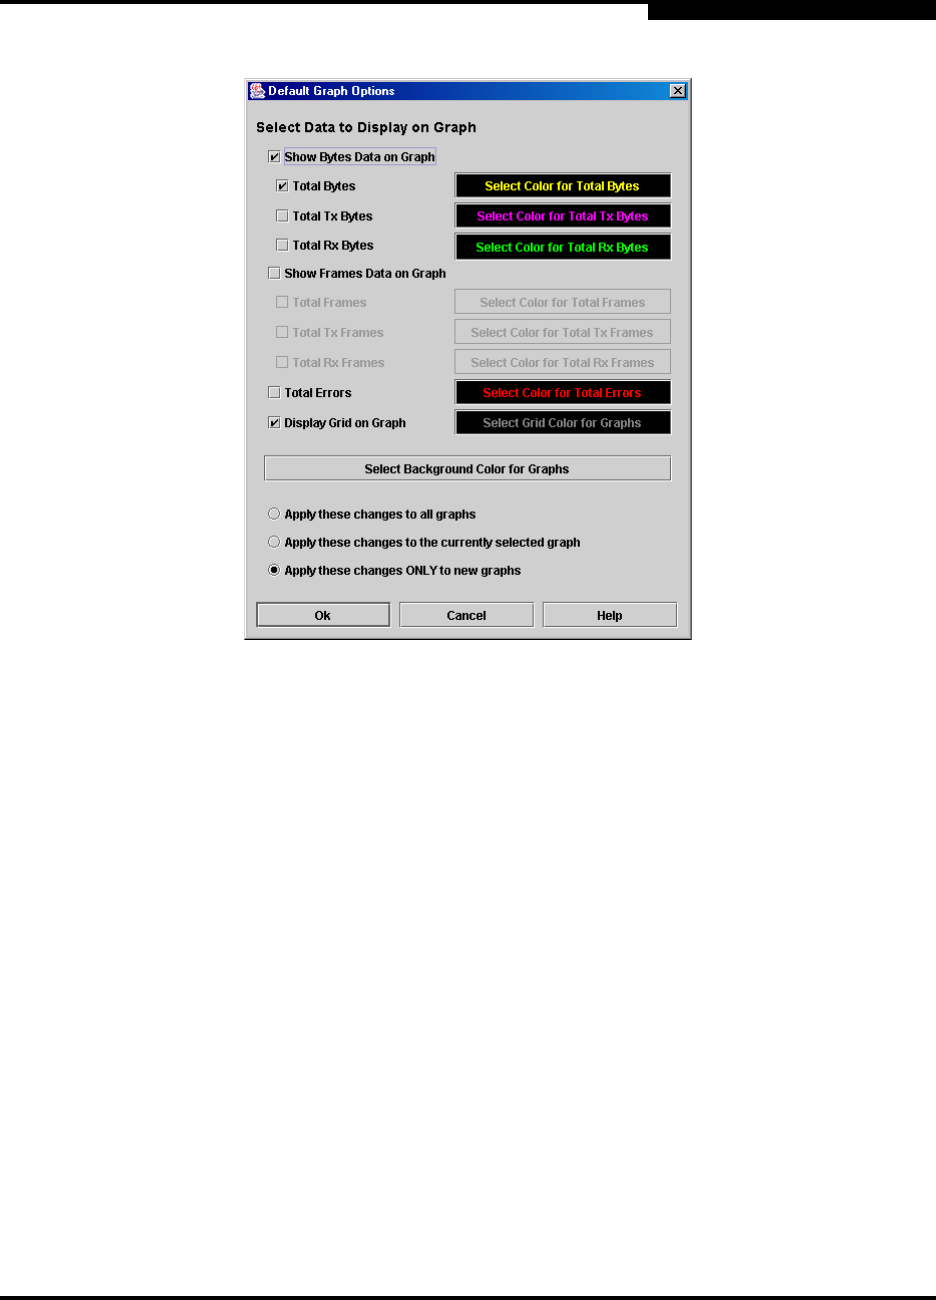
Figure B-5. Default Graph Options Dialog
To modify the graph options, do the following:
1. Choose the units for the graph:
Select the Show Bytes Data on Graph check box to plot data in
KBytes/second
Select the Show Frames Data on Graph check box to plot data in
frames/second.
2. Choose what data type to plot. For example, if you selected Show Frames
Data on Graph in step 1, you can plot one or all of the following:
Total frames transmitted and received (Total Frames)
Total frames transmitted (Total Tx Frames)
Total frames received (Total Rx Frames)
In addition to these, you can also plot total errors by selecting the Total
Errors check box.
3. Display or hide the unit grid. Select the Display Grid on Graph check box to
display the unit grid.