


3 – Managing Fabrics
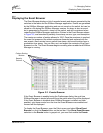
Displaying Fabric Information
3-10 59048-04 Rev. B
D
Browser preference. Refer to ”Setting SANbox Manager Preferences” on
page 2-14.
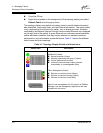
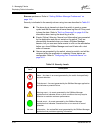
Severity is indicated in the severity column using icons as described in Table 3-2.
Note: The alarm log is cleared out when the switch is reset or power
cycled and that the user should save these log files off if they want
to keep the data. Refer to ”Set Log Command” on page A-44 for
information about saving the alarm log to a file.
Events (Critical, Warning, Normal, and Informative) are generated
by the application and are not saved on the switch. They are
permanently discarded when you close a SANbox Manager
session, but you can save these events to a file on the workstation
before you close SANbox Manager and read it later with a text
editor or browser.
Alarms are generated by the switch, stored on switch, and will be
retrieved when the application is restarted. Some alarms are
configurable. Refer to ”Configuring Port Threshold Alarms” on
page 4-16.
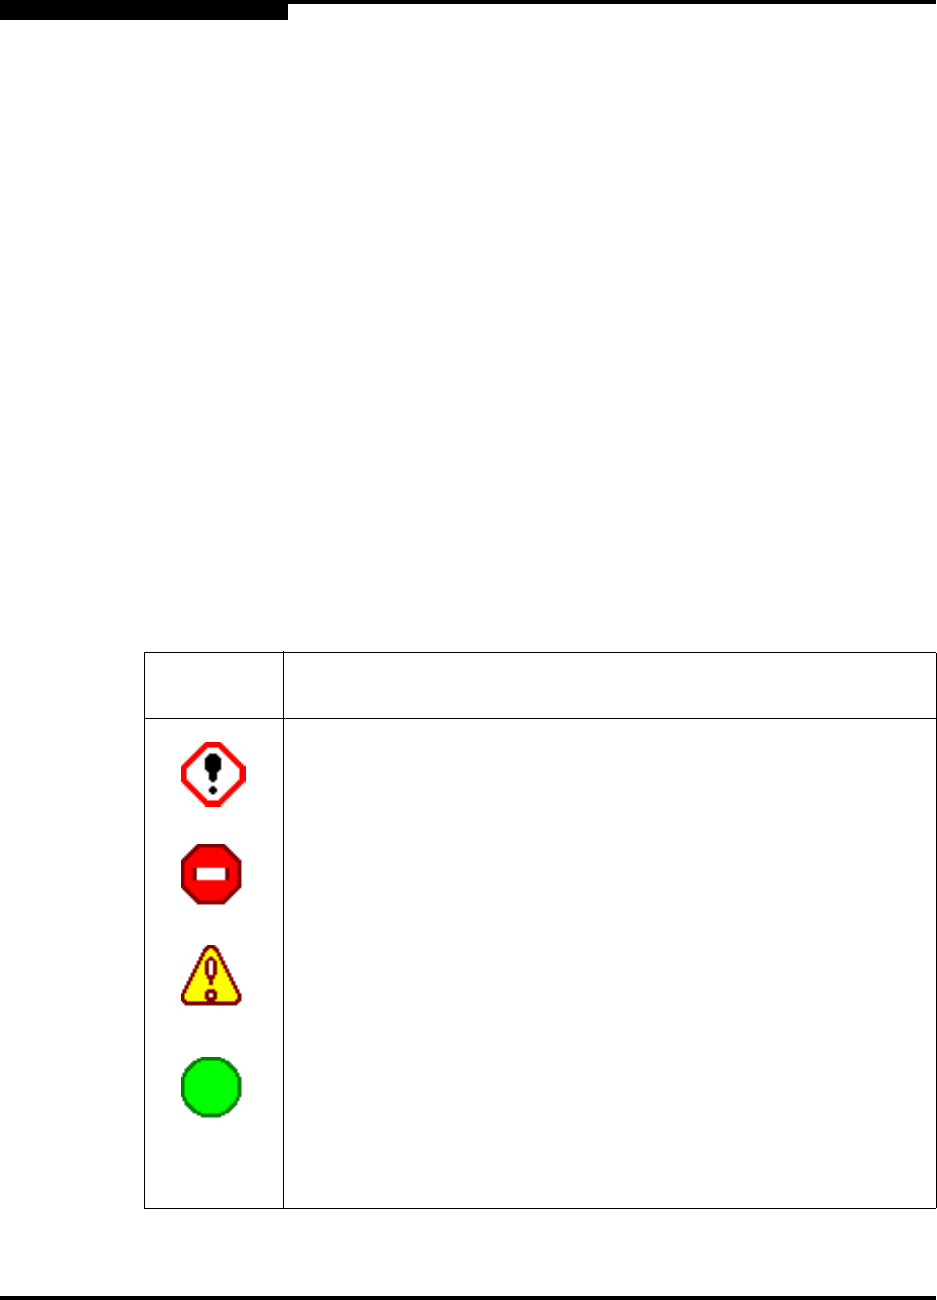
Table 3-2. Severity Levels
Severity
Icon
Description
Alarm – An alarm is an event generated by the switch that specifically
requests attention.
Critical event – An event generated by the SANbox Manager application
and indicates a potential failure.
Warning event – An event generated by the SANbox Manager
application that indicates errors or other conditions that may require
attention to maintain maximum performance.
Normal event – An event generated by the SANbox Manager
application that indicates a transition from a non-normal to normal
operation.
No icon Informative – An unclassified event generated by the SANbox Manager
application that provides supporting information.