


3 – Managing Fabrics
Displaying Fabric Information
59048-04 Rev. B 3-9
D
3.3.2
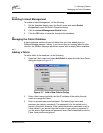
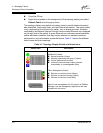
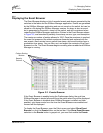
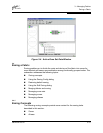
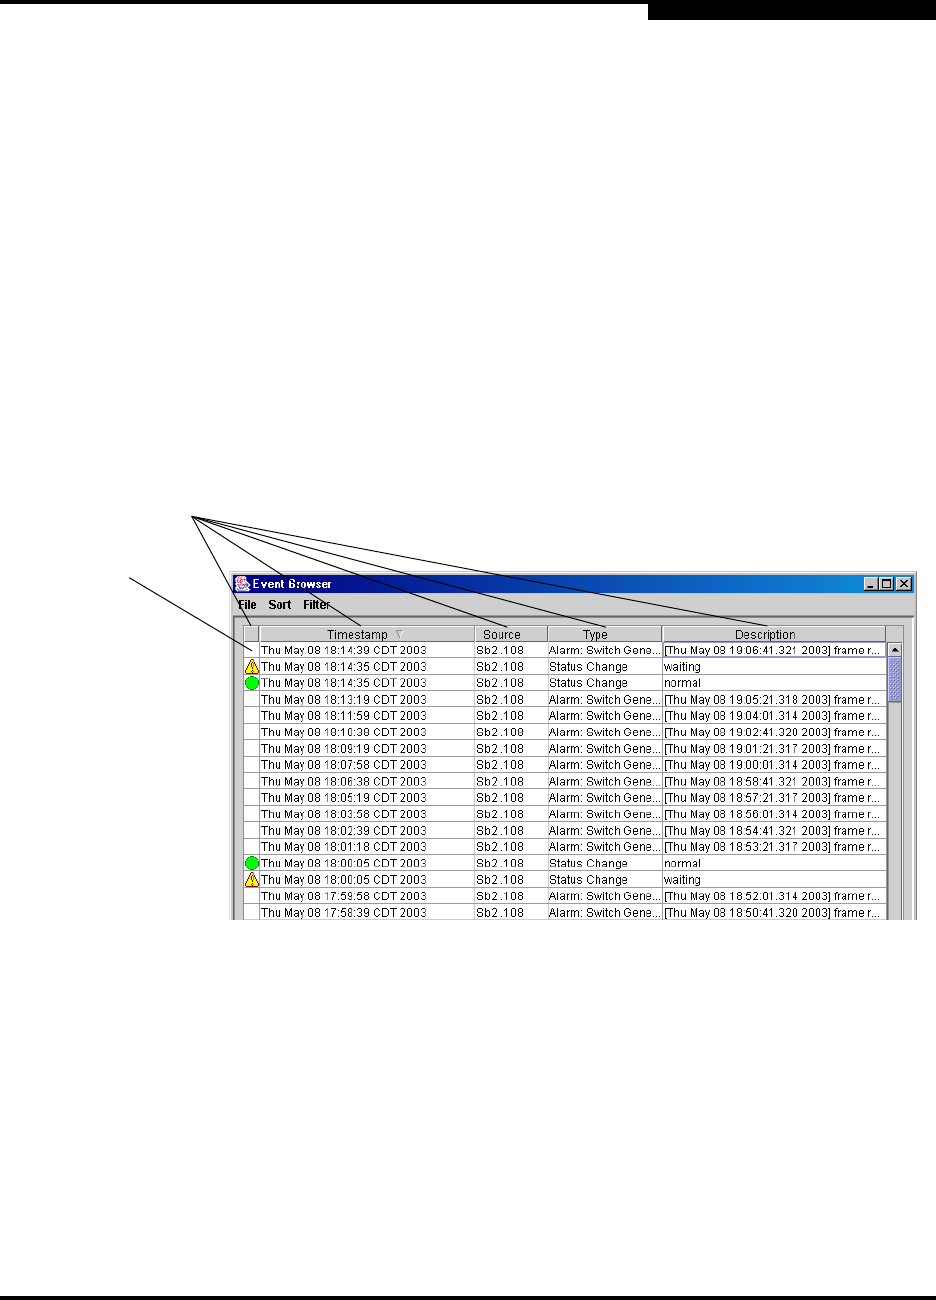
Displaying the Event Browser
The Event Browser displays a list of recorded events and alarms generated by the
switches in the fabric and the SANbox Manager application. Events are generated
by the SANbox Manager application and are not saved on the switch, but can be
saved to a file during the SANbox Manager session. An alarm is also an event,
but is generated by the switch, stored on the switch, and will be retrieved when
restarting the SANbox Manager application. Entries in the Event Browser shown
in Figure 3-2, are formatted by severity, time stamp, source, type, and description.
The maximum number of entries allowed is 1500. Once the maximum is reached,
the event list wraps and the oldest events are discarded and replaced with the
new events. Alarm entries have a switch time stamp, while event entries have a
workstation time stamp. You can filter, sort, and export the contents of the Event
Browser to a file. The Event Browser begins recording when enabled and SANbox
Manager is running.
Figure 3-2. Events Browser
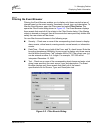
If the Event Browser is enabled using the Preferences dialog, the next time
SANbox Manager is started all events from the switch alarm log will be displayed.
If the Event Browser is disabled when SANbox Manager is started and later
enabled, only those events from the time the Event Browser was enabled and
forward will be displayed.
To display the Event Browser, open the Fabric menu and select Show Event
Browser, or click the Events button on the tool bar. If the Show Event Browser
selection or the Events button is grayed-out, you must first enable the Events
Column Sorting
Buttons
Severity
Column