


This soft copy for use by IBM employees only.
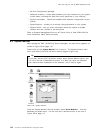
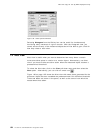
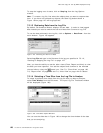
Figure 99. Chart Options Window
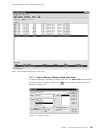
Selecting Histogram from the Gallery box can be useful for simultaneously
monitoring many instances of a given counter. With the Histogram view, you
cannot see the history of the measured objects but will be able to gain a feel for
how they relate to each other.
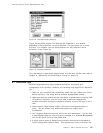
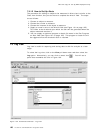
7.4 Alert View
Alert view is useful when you want to determine how many times a certain
occurrence takes place in relation to a certain object. Alternatively, use Alert
view if you want to take corrective action when the measured object reaches a
predetermined threshold.
To select the Alert view, click on the View pull-down menu and then select the
Alert option. Alternatively, you can click on smart icon .
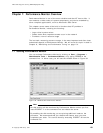
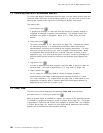
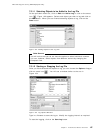
Figure 100 on page 125 shows the Alert view with some alerts generated for the
processor object that has exceeded the predetermined 10% utilization threshold.
Times and dates are shown in the panel, as well as the server from which the
measurement was taken.
124 PC Server and Windows NT Integration Guide