


This soft copy for use by IBM employees only.
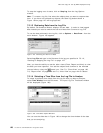
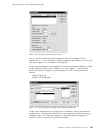
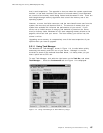
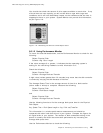
Figure 112. CPU Utilization with TME 10 NetFinity
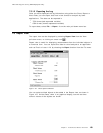
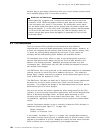
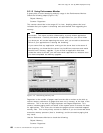
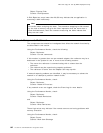
8.4.1.1 Measuring Multiprocessor Load
In a multiprocessor server, the best way to measure the overall load
experienced by the combination of CPUs is to check the following object
(Figure 113):
Object: System
Counter: % Total Processor Time
Figure 113. Multiprocessor Load Measurement
If this value is consistently high (80% or more) and disk as well as network
counter values are low, then an upgrade to the processor may be the solution.
Note: Refer to 8.7, “Network Components Bottleneck” on page 142 for more
details on network object monitoring.
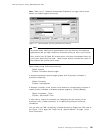
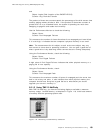
With TME 10 NetFinity, you will see that as soon as you have multiple CPUs
installed, you will have monitors available for each CPU. Refer to 6.6, “System
Monitor” on page 116 for more information.
8.5 Memory Bottlenecks
Windows NT has the ability to self-optimize certain aspects of the system. This
self-optimization or tuning is focused on memory caching and pagefile
administration. The tuning is achieved by using memory caching and balancing
it by growing the size of the pagefile in anticipation of the load demand that the
system expects. The memory management pre-emptively adjusts the amount of
caching memory available to best suit the operating conditions.
This is why, on a system that is heavily used, the amount of unused memory
seems to be high. The system is trying to buffer the ultra-high demand peaks
136 PC Server and Windows NT Integration Guide