This soft copy for use by IBM employees only.
To stop the logging once it starts, click on Stop Log from the Log Options
window.
Note: To create a log file, first select the objects that you want to capture data
from. If you have not selected any objects, the Start Log button shown in
Figure 104 on page 127 will be grayed out.
7.5.1.3 Retrieving Data from the Log File
By default, Performance Monitor displays current data. In order to view logged
data instead you need to
switch
the source of data from Current to Log File.
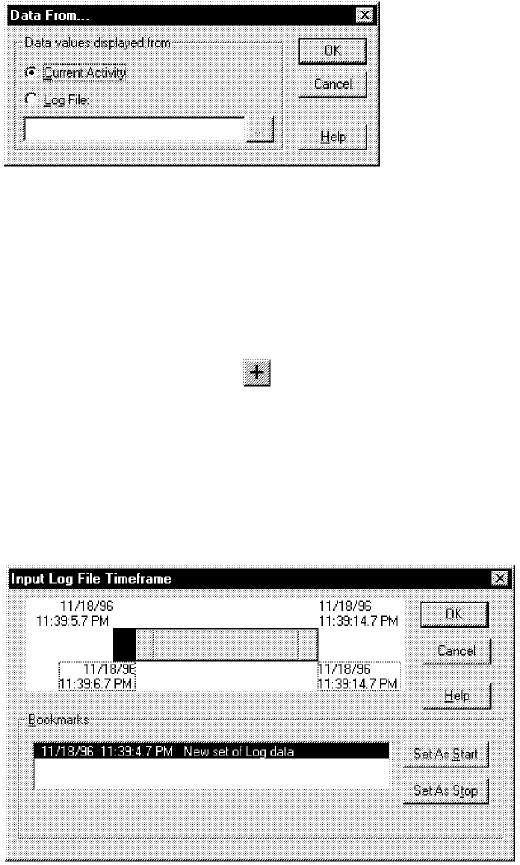
To use the data collected in the log file, click on Options
→ Data From... from the
main window. Figure 105 appears.
Figure 105. Selecting the Source of Data
Select Log File and type in the filename of the log you specified in 7.5.1.2,
“Starting or Stopping the Log File” on page 127.
Now, you have the ability to use the other views (Chart, Report and Alert) to view
the data you have captured. You add the objects and counters to the selected
view as before, using the smart icon. See 7.3, “Chart View” on page 120,
7.6, “Report View” on page 129 and 7.4, “Alert View” on page 124 for details.
7.5.1.4 Selecting a Time Slice from the Log File to Analyze
To select a particular time frame from the log file that you want to analyze,
select Time Window from the Edit menu. The Input Log File Timeframe window
will be displayed (Figure 106).
Figure 106. Time Slice Option Window
You can use the slider bar in Figure 106 to change the time window of the data
that you are analyzing.
128 PC Server and Windows NT Integration Guide


