


This soft copy for use by IBM employees only.
and
Object: Logical Disk (location of the PAGEFILE.SYS)
Counter: Avg. Disk sec/Transfer
The product of these two counters equals the percentage of the disk access time
used by paging memory blocks to disk. If the product of these two counters is
greater than 10 on a sustained basis, the system is spending too much time
swapping to pagefile and needs more memory.
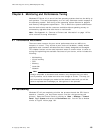
Use the Performance Monitor to check the following:
Object: Server
Counter: Pool Nonpaged Failures
This measures the number of times allocations from nonpaged pool have failed.
If it is too high, it indicates that the computer′s physical memory is too small.
Note: The measurement for this object, as well as the next object, may vary
from server to server due to operating conditions. You can gain a good feel of
what a good value is by observing similar servers that are running adequately.
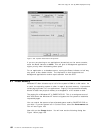
Using the Performance Monitor, check the following:
Object: Server
Counter: Pool Paged Failures
A high value of Pool Paged Failures indicates that either physical memory or a
paging file is near capacity.
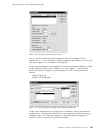
Using the Performance Monitor, check:
Object: Server
Counter: Pool Nonpaged Peak
This measures the maximum number of bytes of nonpaged pool the server has
had in use at any one point. It also indicates how much physical memory the
computer should have and gives a good feel as to what extent you should
upgrade your server′s memory to.
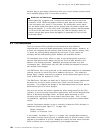
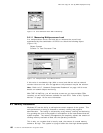
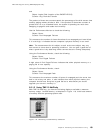
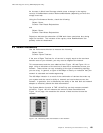
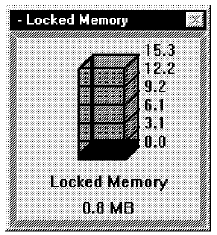
8.5.1.3 Using TME 10 NetFinity
With TME 10 NetFinity, you have the following displays available to measure
memory usage. Locked memory, as depicted in Figure 116, is the base amount
of memory that the operating system uses.
Figure 116. Monitoring Locked Memory Utilization
Chapter 8. Monitoring and Performance Tuning 139