


This soft copy for use by IBM employees only.
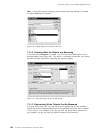
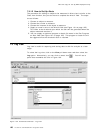
7.5.1.5 Exporting the Log
Once you have displayed the log information using either the Chart, Report or
Alert views, you can export that view in text format for analysis by other
applications. The data can be exported in
•
.TSV format (tab separated variable)
•
.CSV format (comma separated variable)
To export data, select File
→ Export... from the main pull-down menu bar.
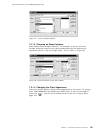
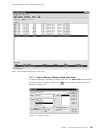
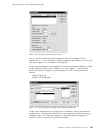
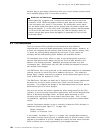
7.6 Report View
The report view can be displayed by selecting Report View from the View
pull-down menu, or clicking on smart icon .
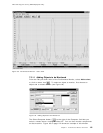
Report view is useful for displaying measurements from the individual objects in
a numerical form. You can export this data for trend analysis to an application
such as Excel or Lotus 1-2-3 by choosing the Export function from the File menu.
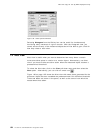
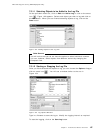
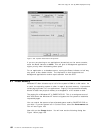
Figure 107. Chart Options Window
You can select multiple objects to be added in the Report view, as shown in
Figure 107. Unlike charts, there is no graphical display, but the real-time
numeric values of the objects are shown.
Chapter 7. Performance Monitor Overview 129