


This soft copy for use by IBM employees only.
Note: Refer to 8.7, “Network Components Bottleneck” on page 142 for more
details on network object monitoring.
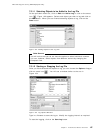
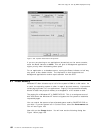
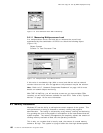
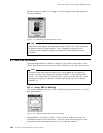
Figure 111. Checking CPU Use using Performance Monitor
Note
Be careful when making this measurement since the amount of foreground
applications that are open drastically influences what you see in your results.
Also, most of the 3D Open GL screen savers can place unnecessary strain on
your server when they are used. These screen savers could be the cause of
the problem and should not be used.
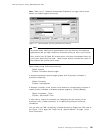
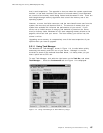
Other checks using Performance Monitor:
Object: System
Counter: Processor Queue Length
A sustained processor queue length greater than 2 generally indicates a
processor bottleneck.
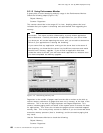
Object: Processor
Counter: Interrupts/sec
A dramatic increase in this counter value without a corresponding increase in
system activity indicates a hardware problem (typically, a failed adapter).
Object: Processes (_Total)
Counter: %Processor Time
If more than a couple of processes are contending for the majority of the
processor time, a faster processor or an additional processor should be
considered.
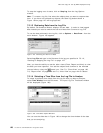
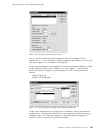
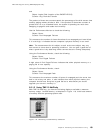
You can also use TME 10 NetFinity′s System Monitor to display the CPU load as
per Figure 112 on page 136. Refer to 6.6, “System Monitor” on page 116 for
more information.
Chapter 8. Monitoring and Performance Tuning 135