


Chapter 19
Using Spectrum Analysis
This chapter introduces you to the concept of frequency and describes the Sound Forge® Pro Spectrum Analysis. Spectrum Analysis
allows you to examine audio frequencies and overtones using either spectrum graphs or sonograms.
Working in the frequency domain
Unlike the waveform display, which represents audio in the time domain (amplitude vs. time), Spectrum Analysis allows you to examine
sound by representing the sound in the frequency domain (amplitude vs. frequency).
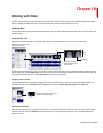
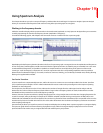
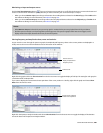
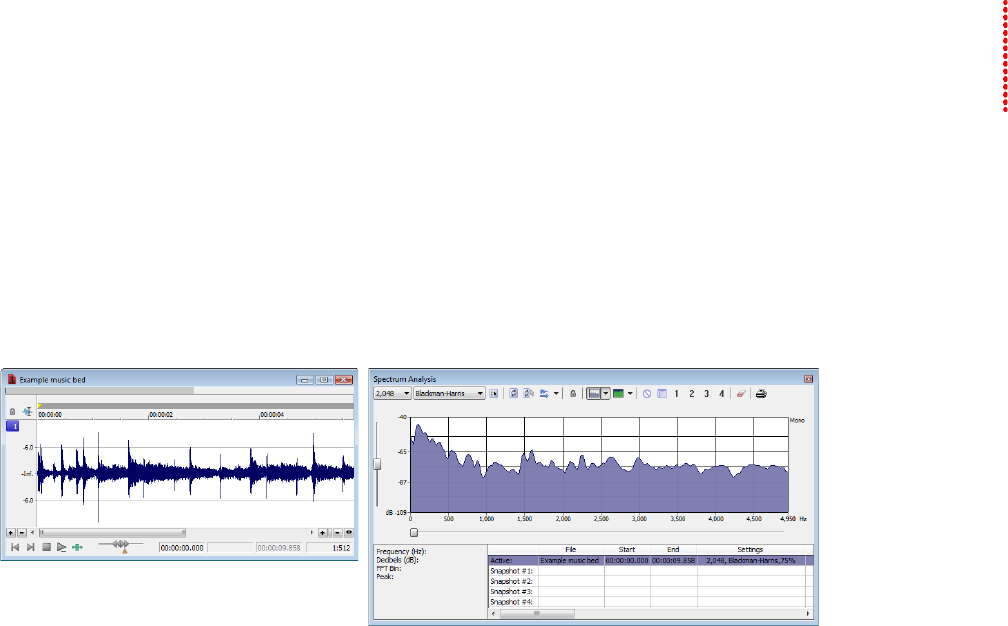
Consider the following graphic, which depicts the same audio event as a waveform and as a spectrum graph.
Waveform display
Spectrum graph
Data displayed in the frequency domain (whether in the form of a spectrum graph or sonogram) shows the amplitudes and frequencies
of sine waves that, if mixed together, would sound much like the original sound. Since it’s relatively easy to remember how a sine wave
sounds at different frequencies, it’s possible to visualize how simple waveforms sound by looking at the spectrum of the sound.
Learning to “read” the frequency components of a sound in conjunction with their corresponding amplitudes makes it possible to
determine the fundamental frequency of a sound, as well as its overtones. Similarly, you can identify unwanted noise, thereby allowing
filtering to be applied where needed.
Fast Fourier Transform
A Fourier transform is computationally intensive, and for this reason it is common to use a technique called a Fast Fourier Transform
(FFT) to perform spectral analysis. The FFT utilizes mathematical shortcuts to reduce the processing time at the expense of putting
limitations on the analysis size.
The analysis size, also referred to as the FFT size, indicates the number of samples from the audio signal used in analysis and also
determines the number of discrete frequency bands. When a large number of frequency bands are used, the bands have a smaller
bandwidth and this provides for more accurate frequency readings.
However, because complex sounds have a rapidly changing spectrum, a large analysis size can blur the time-changing frequencies of a
sound. For example, when performing FFT analysis of an audio file sampled at 44,100 Hz using an analysis size of 4096, almost 100
milliseconds (44,100/4096) of sound are analyzed. If the sound is not constant for those 100 milliseconds, it is impossible to focus on the
instantaneous spectrum at smaller time intervals. This is the trade-off between time resolution and frequency resolution encountered
when analyzing audio signals.
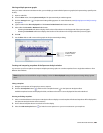
Spectrum Analysis allows you to perform precise FFT analysis and displays the resulting data in a spectrum graph or a sonogram display.
The spectrum graph allows real-time monitoring of playback or input, while the sonogram displays a playback cursor for real-time
preview. Both formats make it easy to navigate data and read audio frequency and position.
USING SPECTRUM ANALYSIS | 279