


20021201
3-2-1
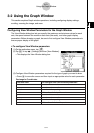
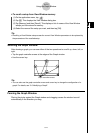
Using the Graph Window
3-2 Using the Graph Window
This section explains Graph window operations, including configuring display settings,
scrolling, zooming the image, and more.
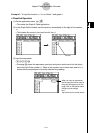
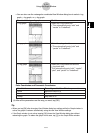
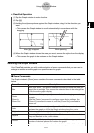
Configuring View Window Parameters for the Graph Window
The View Window dialog box lets you specify the maximum and minimum values for each
axis, the space between the marks on each axis (the scale), and other graph display
parameters. Before drawing a graph, be sure to first configure View Window parameters to
ensure proper display of the graph.
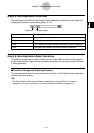
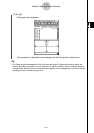
u To configure View Window parameters
(1) On the application menu, tap
T
.
(2) Tap 6, or tap O, [Settings] and then [View Window].
• This displays the View Window dialog box.
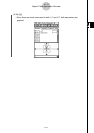
(3) Configure View Window parameters required for the type of graph you want to draw.
•Press c to move the cursor and then input an appropriate value for each parameter.
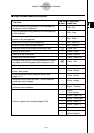
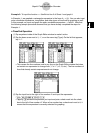
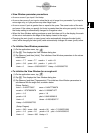
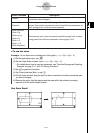
Rectangular Coordinates
Use this item: To configure this View Window parameter:
xmin
xmax
xscale
xdot
ymin
ymax
yscale
ydot
x
-axis minimum value
x
-axis maximum value
x
-axis marker spacing
Value of each dot on the
x
-axis
y
-axis minimum value
y
-axis maximum value
y
-axis marker spacing
Value of each dot on the
y
-axis