


20021201
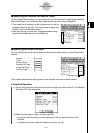
k Specifying the Function You Want to Graph
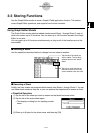
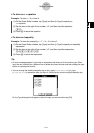
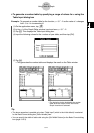
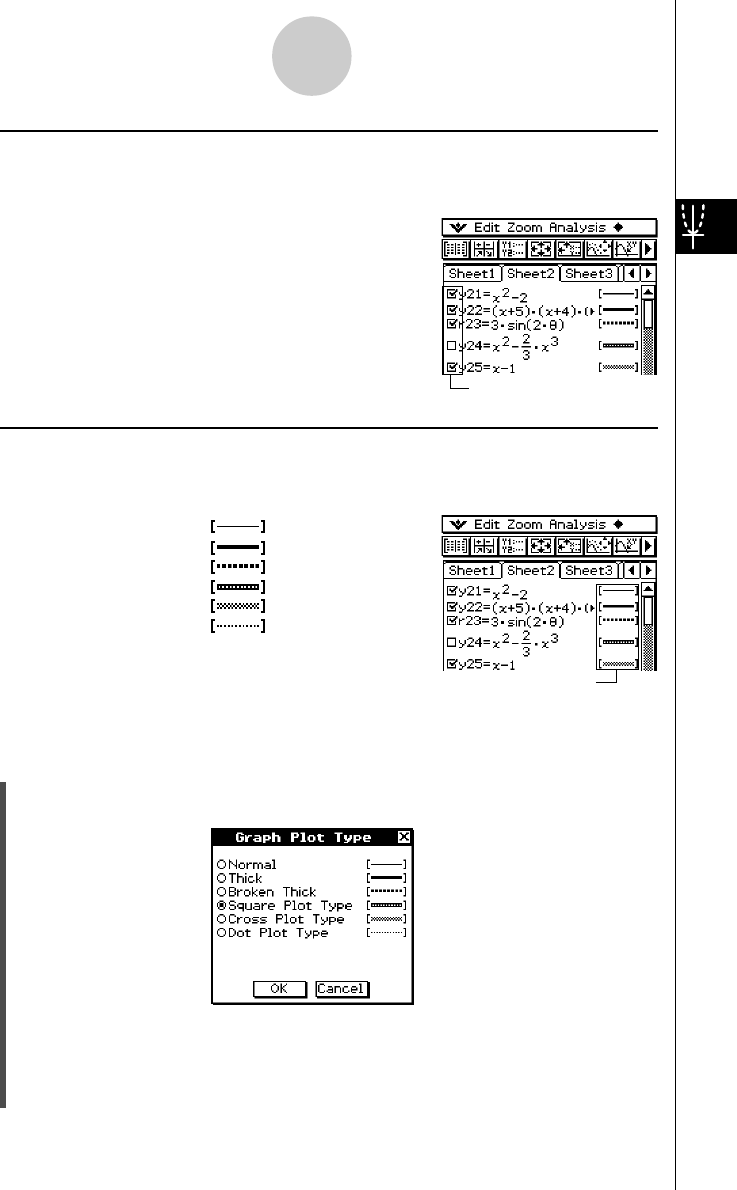
On the Graph Editor window, you can select one or more functions for graphing by selecting
their check boxes. The functions whose check boxes are cleared are not graphed.
• This check box is selected, so the function next to it will be
graphed when you tap $. If you do not want to graph this
function, tap the check box to clear it.
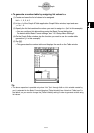
•Each time you tap a check box, it toggles between being
selected (checked) and cleared (unchecked).
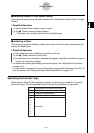
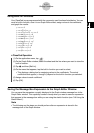
k Specifying the Graph Line Style
You can specify one of the six line styles shown below for each function on the Graph Editor
window.
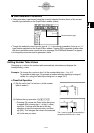
Normal..........................
Thick.............................
Broken Thick ................
Square Plot Type..........
Cross Plot Type ............
Dot Plot Type................
The currently selected line style appears in the line style area next to each function.
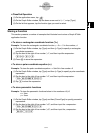
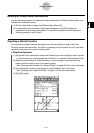
u ClassPad Operation
(1) Tap the line style next to the function whose line style you want to specify. This displays
the Graph Plot Type dialog box.
3-3-8
Storing Functions
Line style area
Check box
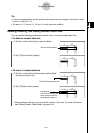
(2) Select the line style you want, and then tap [OK].
•A preview of the line style you select appears in the line style area next to the
function.
•To graph the function using the selected line style, tap $.