


20021201
u To determine coordinates at a particular point on a graph
Example: To graph the function y = x (x + 2)(x – 2) and determine the y-coordinate when
x = 0.5, and the x-coordinate when y = 2.2
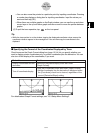
(1) Display the View Window dialog box, and then configure it with the following
parameters.
xmin = –7.7, xmax = 7.7, xscale = 1
ymin = –3.8, ymax = 3.8, yscale = 1
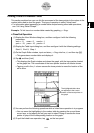
(2) On the Graph Editor window, input and store y = x (x + 2)(x – 2) into line y1, and then
tap $ to graph it.
•Make sure that only y1 is checked.
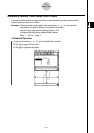
(3) To obtain the value of y for a particular x-value, tap [Analysis], [G-Solve], and then
[y-Cal].
• This displays a dialog box for specifying the x-value.
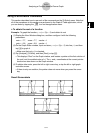
(4) For this example, input 0.5 and then tap [OK].
• This moves the pointer to the location on the graph where x = 0.5, and displays the
x-coordinate and y-coordinate at that location.
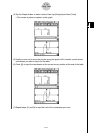
(5) To obtain the value of x for a particular y-value, tap [Analysis], [G-Solve], and then
[x-Cal].
• This displays a dialog box for specifying the y-value.
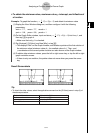
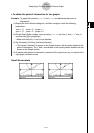
(6) For this example, input 2.2 and then tap [OK].
• This moves the pointer to the location on the graph where y = 2.2, and displays the
x-coordinate and y-coordinate at that location.
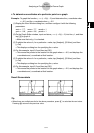
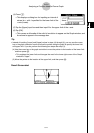
Result Screenshots
3-8-5
Analyzing a Function Used to Draw a Graph
Tip
• When there are multiple results for the above procedure, press e to calculate the next value.
Pressing d returns to the previous value.