


20021201
u To obtain the minimum value, maximum value, y-intercept, and inflection of
a function
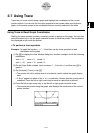
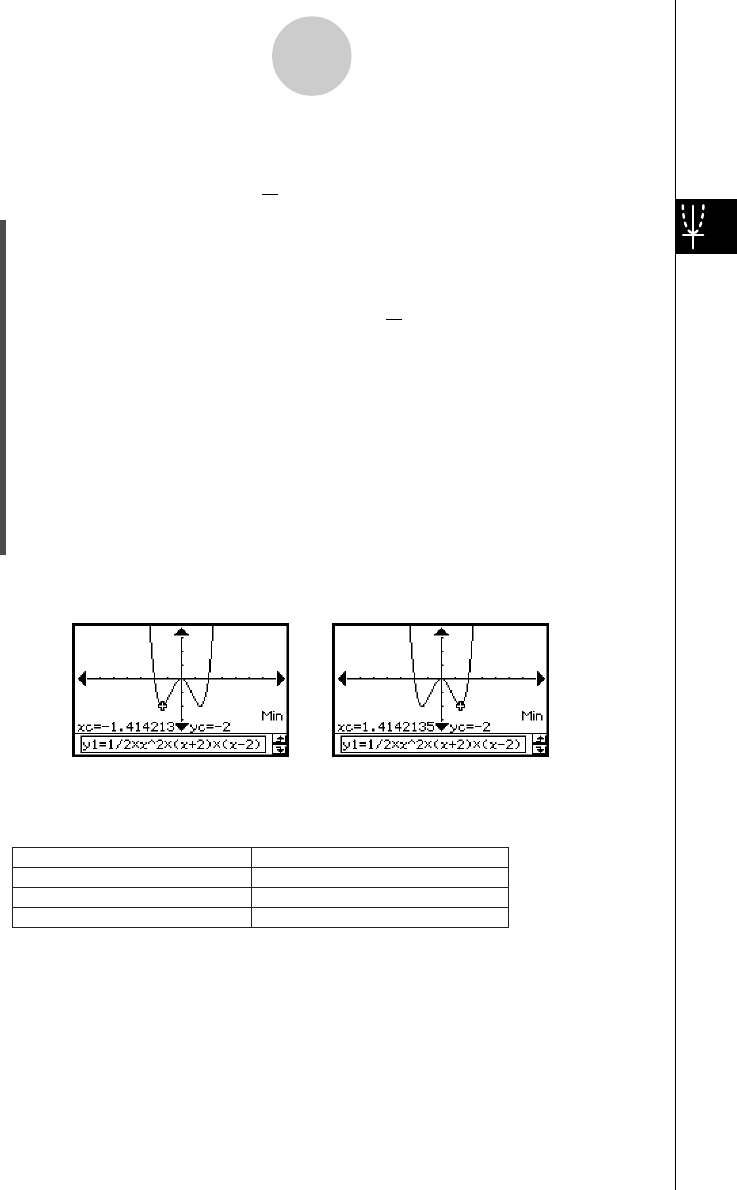
Example: To graph the function y = x
2
(x + 2)(x – 2) and obtain its minimum value
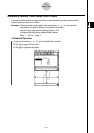
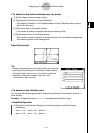
(1) Display the View Window dialog box, and then configure it with the following
parameters.
xmin = –7.7, xmax = 7.7, xscale = 1
ymin = –3.8, ymax = 3.8, yscale = 1
(2) On the Graph Editor window, input and store y = x
2
(x + 2)(x – 2) into line y1, and
then tap $ to graph it.
•Make sure that only y1 is checked.
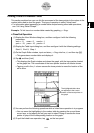
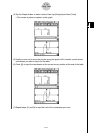
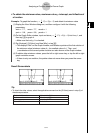
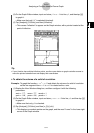
(3) Tap [Analysis], [G-Solve], and then [Min], or tap I.
• This displays “Min” on the Graph window, and locates a pointer at the first solution of
the minimum value (minimum value of y for smallest value of x). The x- and
y-coordinates at the current pointer location are also shown on the Graph window.
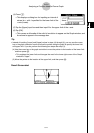
(4) To obtain other minimum values, press the left or right cursor key, or tap the left or right
graph controller arrows.
• If there is only one solution, the pointer does not move when you press the cursor
key.
Result Screenshots
3-8-3
Analyzing a Function Used to Draw a Graph
1
2
1
2
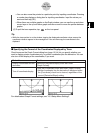
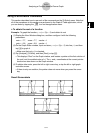
Tip
•To obtain the other values, select the applicable command on the [G-Solve] menu in step (3) of
the above procedure.
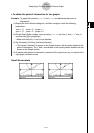
Maximum value
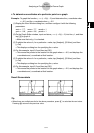
y-intercept
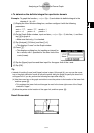
Point of inflection
Max (or tap U)
y-Intercept
Inflection
Select this G-Solve menu command:
To obtain this value: