


20021201
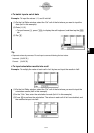
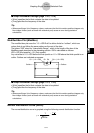
u XList
Tap the down arrow button, and then select the name of the list (list1 through list6, or a list
name you assigned) that you want to use for x-axis data.
•You need to specify only an XList in the case of single-variable statistics (page 7-4-1). The
initial default [XList] setting is “list1”.
u YList
Tap the down arrow button, and then select the name of the list (list1 through list6, or a list
name you assigned) that you want to use for y-axis data.
•Specify a YList in addition to an XList in the case of paired-variable statistics (page 7-5-1).
The initial default [YList] setting is “list2”.
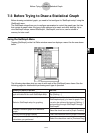
7-3-3
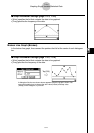
Before Trying to Draw a Statistical Graph
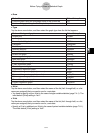
u Draw
Scatter plot
Scatter
xy line graph
xyLine
Normal probability plot
NPPlot
Histogram
Histogram
Med-box plot
MedBox
Modified-box plot
ModBox
Normal distribution curve
NDist
Broken line graph
Broken
Linear regression graph
LinearR
Med-Med graph
MedMed
Quadratic regression graph
QuadR
Cubic regression graph
CubicR
Quartic regression graph
QuartR
Logarithmic regression graph
LogR
Exponential regression graph (y = a
.
e
b
.
x
)
ExpR
Exponential regression graph (y = a
.
b
x
)
abExpR
Power regression graph
PowerR
Sinusoidal regression graph
SinR
Logistic regression graph
LogisticR
Select this option:To draw this type of graph:
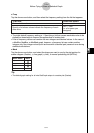
Draw the graph using the StatGraph setup of the current tab
Not draw the graph using the StatGraph setup of the current tab
On
Off
Select this option:To do this:
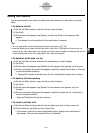
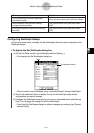
u Type
Tap the down arrow button, and then select the graph type from the list that appears.