


20021201
u To graph the inverse of a function
Example: To graph y = x
2
– x – 2 and then overlay it with x = y
2
– y – 2
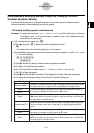
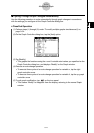
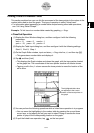
(1) In line y1 of the Graph Editor window, input and save y = x
2
– x – 2.
(2) Tap $ to graph the function.
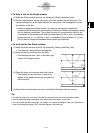
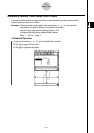
(3) Tap [Analysis], [Sketch], and then [Inverse].
• This graphs the inverse function. The message
box briefly shows the inverse function.
3-6-4
Using the Sketch Menu
Tip
• If a function does not have an inverse, the graph produced by the [Inverse] command will be the
result of interchanging the x and y variables of the original function.
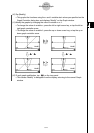
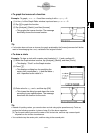
u To draw a circle
Example: To draw a circle with a center point located at (1, 1) and a radius of 2
(1) While the Graph window is active, tap [Analysis], [Sketch], and then [Circle].
• This display “Circle” on the Graph window.
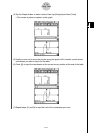
(2) Press 1.
• This displays a dialog box for specifying the
center point coordinates (x, y) and the radius r,
with 1 specified as the value of x.
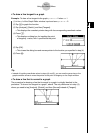
(3) Enter value for x, y, and r, and then tap [OK].
• This closes the dialog box and draws the circle
according to your specifications. The message
box shows the function for the circle.
Tip
• Instead of inputting values, you can also draw a circle using stylus operations only. To do so,
perform the following operation in place of step (2) of the above operation.
(2) Tap the point where you want the center of the circle to be, and then tap a second point
anywhere on the circle's circumference.
•You could also tap the center point, and then drag to the second point.