


20021201
7-7 Performing Statistical Calculations
You can perform statistical calculations without drawing a graph by tapping [Calc] on the
menu bar.
Viewing Single-variable Statistical Calculation Results
Besides using a graph, you can also use the following procedure to view the single-variable
statistics parameter values.
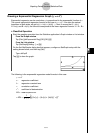
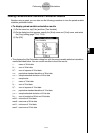
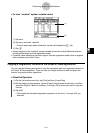
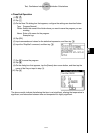
u To display single-variable calculation results
(1) On the menu bar, tap [Calc] and then [One-Variable].
(2) On the dialog box that appears, specify the [XList] name and select the [Freq] setting
(page 7-3-3, 7-3-4).
(3) Tap [OK].
7-7-1
Performing Statistical Calculations
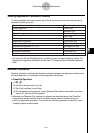
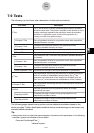
•This displays the Stat Calculation dialog box with the single-variable statistical calculation
results described below. You can use the scrollbar to scroll the results.
o :mean
Σx : sum of data
Σx
2
: sum of squares
xσn : population standard deviation
xσn–1 : sample standard deviation
n : sample size
minX : minimum
Q1 : first quartile
Med : median
Q3 : third quartile
maxX : maximum
Mode : mode*
ModeN : number of data mode items
ModeF : data mode frequency
* If “Mode = ModeStat” is shown on the Stat Calculation dialog box, it means that
solutions are stored in the “ModeStat” system variable. To view the solutions, tap any list
name cell on the List Editor window, input “ModeStat”, and then tap w. This will display
the “ModeStat” system variable contents in the list.
20030201