


20021201
3-7 Using Trace
Trace lets you move a point along a graph and displays the coordinates for the current
pointer location. You can also link the trace operation to the number table used to draw a
graph, so the pointer jumps to the coordinates that are currently selected in the table.
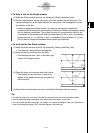
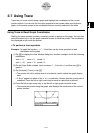
Using Trace to Read Graph Coordinates
Starting the trace operation causes a crosshair pointer to appear on the graph. You can then
press the cursor key or tap the graph controller arrows to move the pointer. The coordinates
are displayed as you move the pointer.
u To perform a trace operation
Example: To graph the function y = x
2
– 3 and then use the trace operation to read
coordinates on the graph
(1) Tap 6 to display the View Window dialog box, and then configure it with the following
parameters.
xmin = –5, xmax = 5, xscale = 1
ymin = –10, ymax = 10, yscale = 2
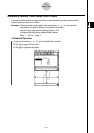
(2) On the Graph Editor window, input and store x
2
– 3 into line y1, and then tap $ to
graph it.
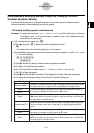
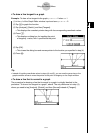
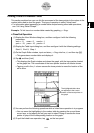
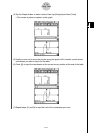
(3) Tap [Analysis], [Trace], or tap =.
• The pointer will not be visible when it is located at a point outside the graph display
area.
• If “Error” appears in place of the xc or yc coordinate, it means that the current point is
undefined. Press the left or right cursor key to move to a point that is defined.
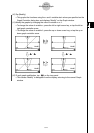
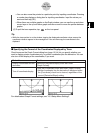
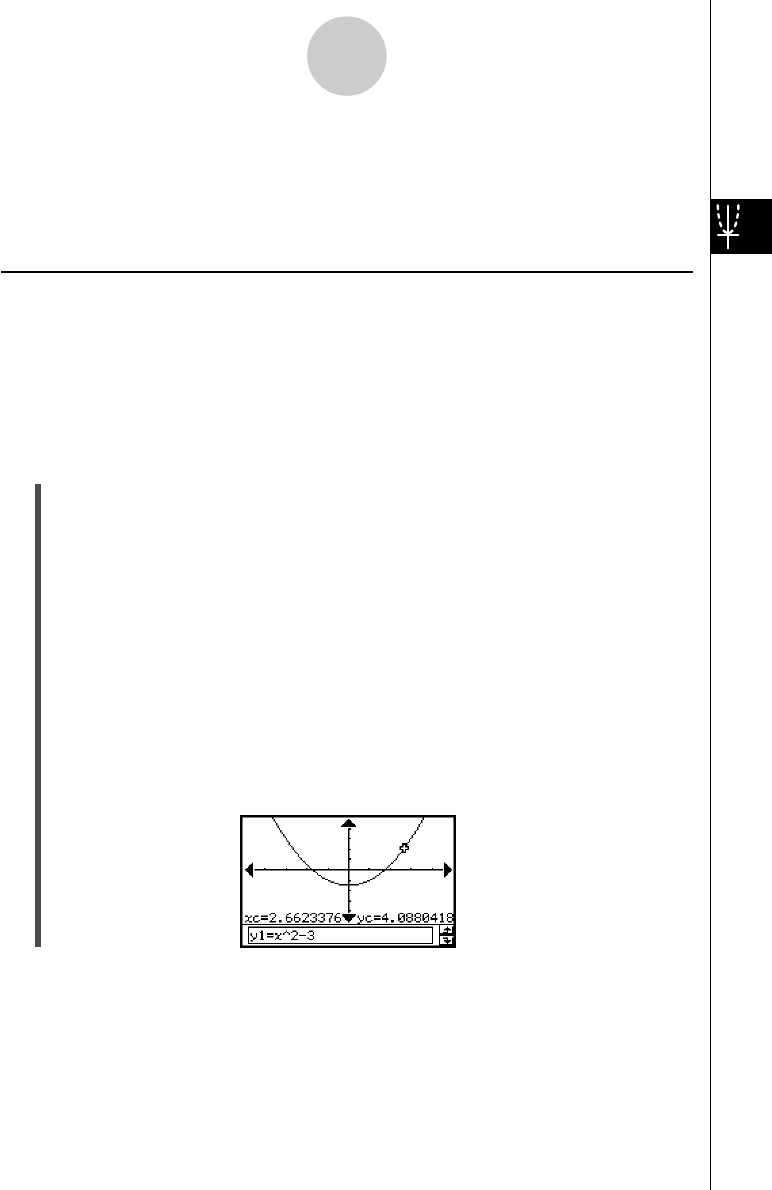
(4) Press the left or right cursor key, or tap the left or right graph controller arrow.
• This moves the pointer along the graph, and displays the coordinates of the current
pointer location.
3-7-1
Using Trace