


20021201
5-5-1
Other 3D Graph Application Functions
5-5 Other 3D Graph Application Functions
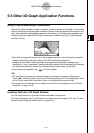
Using Trace to Read Graph Coordinates
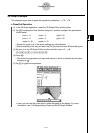
Starting the trace operation causes a crosshair pointer to appear on the graph. You can then
press a cursor key or tap the graph controller arrows to move the pointer to the location you
want, and read the coordinates that appear on the display. To start the trace operation and
display the pointer, make the 3D Graph window active, and then tap =, or tap [Analysis]
and then [Trace].
• Each time you press the cursor key or tap a graph controller arrow, the pointer moves the
distance specified by the [grid] value on the 3D View Window dialog box.
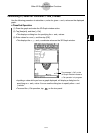
• Inputting a value while a trace operation is being performed displays a dialog box for
inputting an x- and y-coordinate. Inputting values for each of the coordinates on this dialog
box causes the pointer to jump to the corresponding location when you tap [OK].
To cancel the trace operation, tap on the icon panel.
Tip
• The initial default setting for the coordinate display is rectangular coordinates (Rectangular).
Tapping O, [Settings], [Setup], and then [3D Format] displays the 3D Format dialog box, which
you can use to select polar coordinates (Polar) or to hide coordinate values entirely.
• For details about the settings you can configure on the 3D Format dialog box, see “3D Format
Dialog Box” on page 13-3-6.
Inserting Text into a 3D Graph Window
You can insert text into a 3D Graph window and delete it as required.
For more information, see “To write text on the Graph window” on page 3-6-2, and “To clear
figures inserted using the Sketch menu” on page 3-6-5.