


20021201
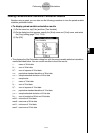
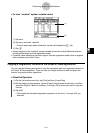
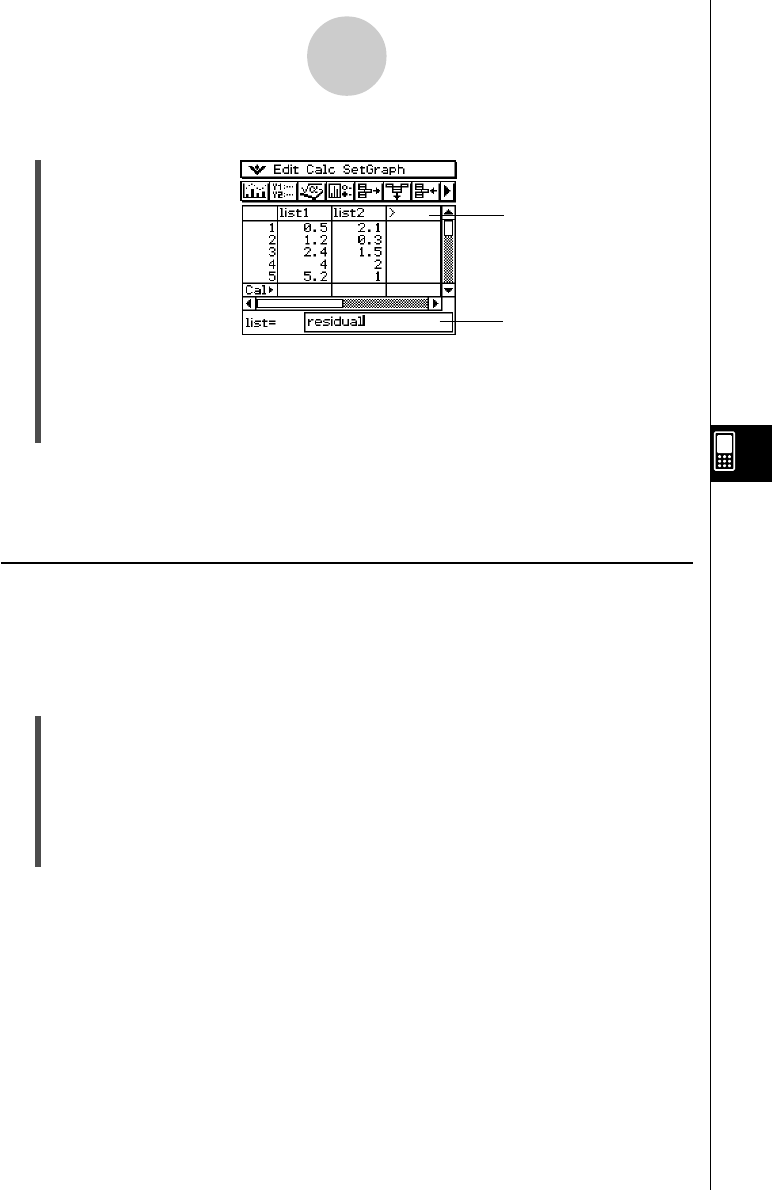
u To view “residual” system variable values
7-7-4
Performing Statistical Calculations
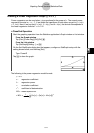
(1) Tap here.
(2) Tap here, and enter “residual”.
• To input lower-case alpha characters, tap the soft keyboard’s 0 tab.
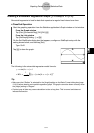
(3) Tap w.
•Values assigned to the “residual” system variable shows the vertical distances between
actually plotted points and the regression model.
•A positive value indicates a plot that is higher than the regression model, while a negative
value indicates a plot that is lower.
Copying a Regression Formula to the Graph & Table Application
You can use the following procedure to copy the calculated result of a regression formula to
the Graph & Table application. There you can use Graph functions to edit and graph the
formula, and perform other operations.
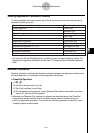
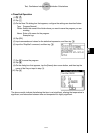
u ClassPad Operation
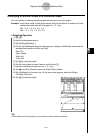
(1) On the List window menu bar, tap [Calc] and then [Linear Reg].
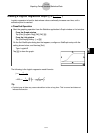
(2) On the dialog box that appears, tap the [Copy Formula] down arrow button, and then
select the Graph & Table line number (y1 through y20) to which you want to copy the
formula.
(3) Tap [OK].
• This copies the calculated regression expression to the line (y1 through y20) you
selected.
(1)
(2)