


20021201
7-3 Before Trying to Draw a Statistical Graph
Before drawing a statistical graph, you need to first configure its “StatGraph setup” using the
[SetGraph] menu.
The StatGraph setup allows you to configure parameters to control the graph type, the lists
that contain a graph’s data, the type of plot markers to be used, and other settings. Up to
nine StatGraph setups, named StatGraph1, StatGraph2, and so on, can be stored in
memory for later recall.
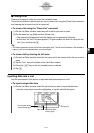
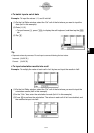
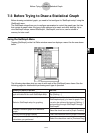
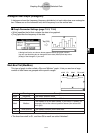
Using the SetGraph Menu
Tapping [SetGraph] on the List Editor window menu bar displays a menu like the one shown
below.
7-3-1
Before Trying to Draw a Statistical Graph
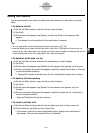
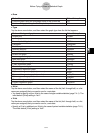
The following describes what you can do with each of the [SetGraph] menu items. See the
following pages for details about performing each type of operation.
Do this:When you want to do this:
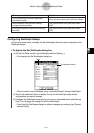
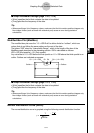
Display a dialog box for specifying the graph
type and data list for each StatGraph setup
Tap [Setting…].
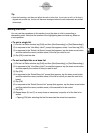
Select a StatGraph setup for graphing
Select the check box(es) next to the
StatGraph setup(s) you want to graph. This
can also be achieved by tapping [Setting...]
and scrolling through StatGraph1 through
StatGraph9.
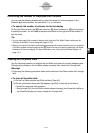
Overlay a function graph on a statistical
graph
Select the check box next to [Graph Function].
Turn off function graph overlay
Clear the check box next to [Graph Function].
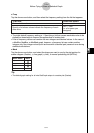
Graph the results of the last regression
calculation you performed
Select the check box next to [Previous Reg].