


20021201
Linking Trace to a Number Table
This section explains how you can link the movement of the trace pointer to the values in the
number table used to draw the graph. This type of operation is called “linked trace”.
• For information about generating a number table and performing other table operations,
see “3-4 Using Table & Graph”.
Example: To link trace to a number table created by graphing y = 3logx
u ClassPad Operation
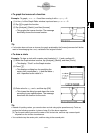
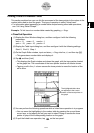
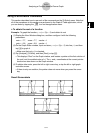
(1) Display the View Window dialog box, and then configure it with the following
parameters.
xmin = –5, xmax = 5, xscale = 1
ymin = –10, ymax = 10, yscale = 2
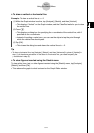
(2) Display the Table Input dialog box, and then configure it with the following settings.
Start: 2, End: 9, Step: 1
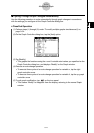
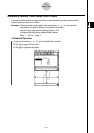
(3) On the Graph Editor window, input and store y = 3logx into line y1, and then tap #.
• This generates a number table and displays it.
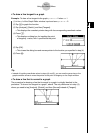
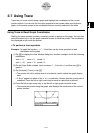
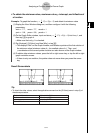
(4) Tap a and then [Link].
• This displays the Graph window and draws the graph, with the trace pointer located
on the graph line. The coordinates of the trace pointer location will also be shown.
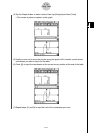
•Tapping a cell in the y1 column causes the trace pointer to move the location of the
cell’s value.
3-7-3
Using Trace
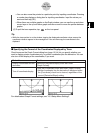
The highlighted table value
corresponds to the current
location of the trace pointer on
the graph.
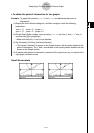
(5) You can perform the following operations while a linked trace operation is in progress.
•You can move the highlighting in the number table by pressing the up and down
cursor keys, or by tapping the cell you want to select. Doing so causes the trace
pointer to jump to the corresponding location on the graph.
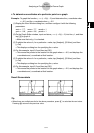
(6) To quit the linked trace operation, tap on the icon panel.