


20021201
3-8-8
Analyzing a Function Used to Draw a Graph
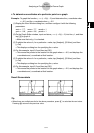
(2) On the Graph Editor window, input and store y1 = x
3
– 1 into line y1, and then tap $
to graph it.
•Make sure that only “y1” is selected (checked).
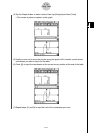
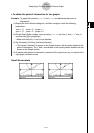
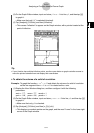
(3) Tap [Analysis], [G-Solve], and then [Inflection].
• This causes “Inflection” to appear on the Graph window, with a pointer located at the
point of inflection.
Tip
• If your function has multiple inflection points, use the cursor button or graph controller arrows to
move the pointer between them and display their coordinates.
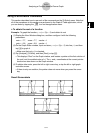
u To obtain the volume of a solid of revolution
Example: To graph the function y = x
2
– x – 2 and obtain the volume of a solid of revolution
as the line segment from x = 1 to x = 2 is rotated on the x-axis
(1) Display the View Window dialog box, and then configure it with the following
parameters.
xmin = –7.7, xmax = 7.7, xscale = 1
ymin = –3.8, ymax = 3.8, yscale = 1
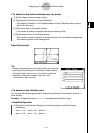
(2) On the Graph Editor window, input and store y = x
2
– x – 2 into line y1, and then tap $
to graph it.
•Make sure that only y1 is checked.
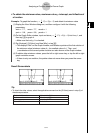
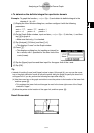
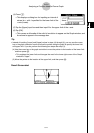
(3) Tap [Analysis], [G-Solve], and then [
π
∫
(f(x))
2
dx].
• This displays a crosshair pointer on the graph, and the word “Lower” in the lower right
corner of the Graph window.