


20021201
3-2-6
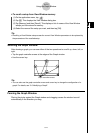
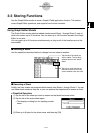
Using the Graph Window
u ClassPad Operation
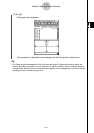
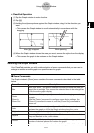
(1) Tap the Graph window to make it active.
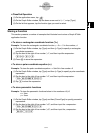
(2) Tap T.
(3) Holding the stylus anywhere against the Graph window, drag it in the direction you
want.
•This causes the Graph window to scroll automatically in accordance with the
dragging.
(4) When the Graph window shows the area you want, remove the stylus from the display.
•This causes the graph to be redrawn on the Graph window.
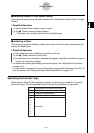
Zooming the Graph Window
Your ClassPad provides you with a wide selection of zoom commands that you can use to
enlarge or reduce an entire graph or a specific area of a graph.
k Zoom Commands
The Graph window’s [Zoom] menu contains the zoom commands described in the table
below.
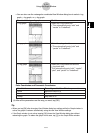
Zoom Command
Description
Box
Factor
Zoom In
Zoom Out
Auto
Original
Square
Round
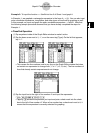
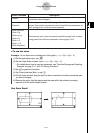
With “box zoom”, you draw a selection boundary around the area you
would like to enlarge. This causes the selected area to be enlarged so
it fills the entire graph display.
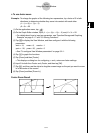
“Factor zoom” lets you specify a zoom factor for enlarging or reducing
a graph.
Use the [Factor] command to configure zoom factor settings, the
[Zoom In] command to zoom in, and the [Zoom Out] command to
zoom out.
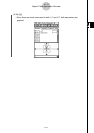
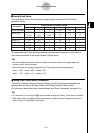
“Auto zoom” automatically configures View Window
y-axis values and
redraws the graph so it fills the Graph window along the y-axis.
Return a graph to its original View Window settings
Executing this command adjusts View Window
x-axis values so that
they are identical to the y-axis values.
Round View Window settings (xmin, xmax, xdot) to an appropriate
number of decimal places and redraw the graph.
This command makes the value of each dot equal 1 which makes all
After T is tapped While panning
20030201