


20021201
12-7-4
Including ClassPad Functions in Programs
Including Statistical Graphing and Calculation Functions in a Program
Including statistical graphs and calculation functions in a program allows the program to
draw statistical graphs and display statistical calculation results.
u To perform statistical graphing
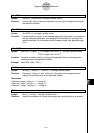
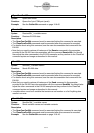
Example 1: Scatter Diagram
{0.5, 1.2, 2.4, 4, 5.2} S list1
{–2.1, 0.3, 1.5, 2, 2.4} S list2
StatGraph 1, On, Scatter, list1, list2, 1, Square
DrawStat
Note that xyLine can also be specified in instead of Scatter for the graph type.
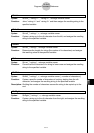
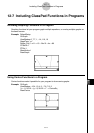
Example 2: Normal Probability Plot
{0.5, 1.2, 2.4, 4, 5.2} S list1
StatGraph 1, On, NPPlot, list1, Square
DrawStat
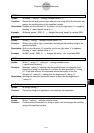
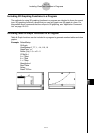
Example 3: Single-variable statistical graphing
{0.5, 1.2, 2.4, 4, 5.2} S list1
StatGraph 1, On, Histogram, list1, list1
DrawStat
Note that MedBox, ModBox, NDist, or Broken can also be specified in instead
of Histogram for the graph type.
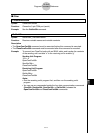
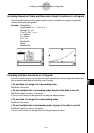
Example 4: Paired-variable statistical graphing
{0.5, 1.2, 2.4, 4, 5.2} S list1
{–2.1, 0.3, 1.5, 2, 2.4} S list2
StatGraph 1,On, LinearR, list1, list2,1
DrawStat
Note that MedMed, QuadR, CubicR, QuartR, LogR, ExpR, abExpR, or
PowerR can also be specified in instead of LinearR for the graph type.
Example 5: Paired-variable statistical graphing (Sinusoidal Regression/Logistic
Regression)
{0.5, 1.2, 2.4, 4, 5.2} S list1
{2.9, 3.8, 3.3, 0.4, 0.2} S list2
StatGraph 1, On, SinR, list1, list2
DrawStat
Note that LogisticR can also be specified in instead of SinR for the graph type.