


20021201
Simultaneously Modifying Multiple Graphs by Changing Common
Variables (Dynamic Modify)
Use the procedure below to change the values of up to two common variables used in
multiple functions to simultaneously modify the graphs.
u To modify multiple graphs simultaneously
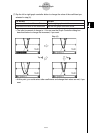
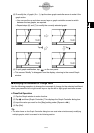
Example: To graph the functions y = ax
2
– b and y = ax + b, and then find out how a change
in variable a from 1 to 4 and a change in variable b from –2 to 2 affect the shape
and position of each graph
(1) On the application menu, tap
T
.
(2) Tap O and then J to display the Main application window.
Tip
• For details about using the Main application, see Chapter 2.
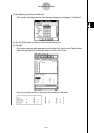
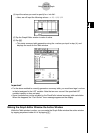
(3) Use the Main application work area to assign values to variables “a” and “b” (a = 1 and
b = 2 in this example).
9VbW aw
cW bw
(4) Tap O and then [Close] to close the Main application window.
(5) Configure View Window parameters.
(6) On the Graph Editor window, input ax
2
– b in line y1, and ax + b in line y2.
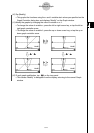
(7) Tap $ to draw the graph.
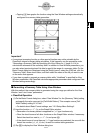
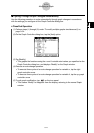
(8) Tap a and then [Graph Controller]. This displays the Graph Controller dialog box.
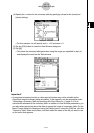
(9) Configure the following settings on the Graph Controller dialog box.
3-5-4
Modifying a Graph
Description
Setting
Dynamic ]':
a
Start: 1
End: 4
Step: 1
Dynamic `$:
b
Start: –2
End: 2
Step: 1
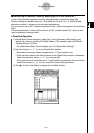
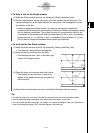
Specifies a variable whose value is changed when you press the left
or right cursor key, or tap the left or right graph controller arrow.
These items specify the upper limit (End) and lower limit (Start) of
the range of change of the Dynamic ]' value.
Use this setting to specify the increment of change in the Dynamic
]' value when you press the left or right cursor key, or tap the left
or right graph controller arrow.
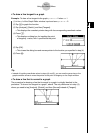
Specifies another variable whose value is changed when you press
the up or down cursor key, or tap the up or down graph controller
arrow.
These items specify the upper limit (End) and lower limit (Start) of
the range of change of the Dynamic `$ value.
Use this setting to specify the increment of change in the Dynamic
`$ value when you press the up or down cursor key, or tap the up
or down graph controller arrow.