


20021201
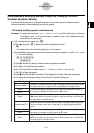
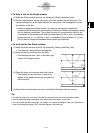
u To draw a line on the Graph window
(1) While the Graph window is active, tap [Analysis], [Sketch], and then [Line].
(2) On the Graph window, tap the start point of the line and then tap the end point. This
causes a straight line to be drawn between the two points. The message box shows
the equation of the line.
• Instead of tapping the Graph window, you can use the keypad to specify the
coordinates of the start point and end point. Pressing a number key displays a dialog
box for inputting coordinates. The value of the key you just pressed is input for the
x-coordinate of the starting point. After inputting values for the x- and y-coordinates
of the start point (x1, y1) and the x- and y-coordinates of the end point (x2, y2), tap
[OK] to draw a straight line between the two points you specified.
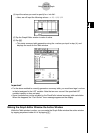
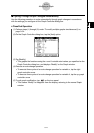
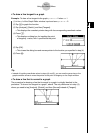
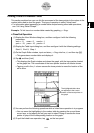
u To write text on the Graph window
(1) While the Graph window is active, tap [Analysis], [Sketch], and then [Text].
• This displays a dialog box for inputting text.
(2) Enter the text you want and then tap [OK].
• This displays the word “Text” in the lower right
corner of the Graph window.
3-6-2
Using the Sketch Menu
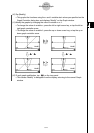
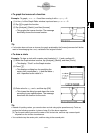
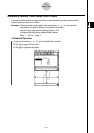
(3) Place the stylus on the screen and hold it there.
• This causes the text you input in step (2) to
appear at the location where you are pointing
with the stylus.
(4) Drag the text to the location you want, and then lift the stylus from the screen.
Tip
• The amount of text you can input is limited only by how much can fit on the Graph window.
•You can repeat the above operation and input multiple text blocks, if you want.
•You cannot edit text after inputting it into a graph. To make any changes in text, you first need to
clear the existing text (page 3-6-5) and then replace it with new text.