


20021201
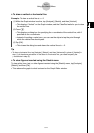
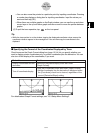
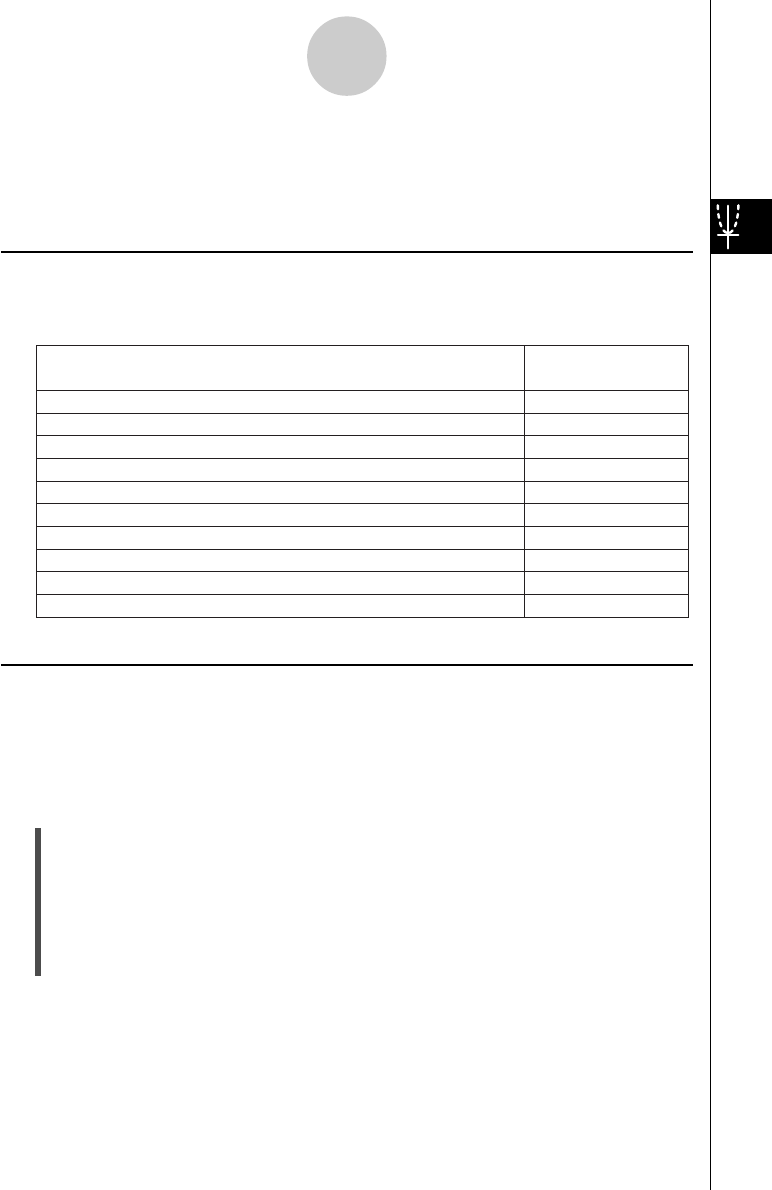
Clear figures and text you have added using the sketch feature
Plot a point on the Graph window
Draw a line on the Graph window
Write text on the Graph window
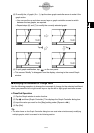
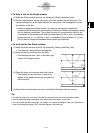
Draw a line that is tangent to a particular point on a graph
Draw a line that is normal to a particular point on a graph
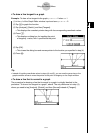
Draw a circle
Draw a vertical line
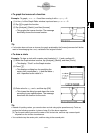
Draw a horizontal line
Graph the inverse of a function
Cls
Plot
Line
Text
Tangent
Normal
Inverse
Circle
Vertical
Horizontal
Select this Sketch
menu command:
To do this:
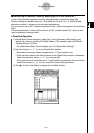
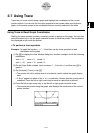
3-6 Using the Sketch Menu
The [Sketch] menu lets you add points, lines, figures, and text after you draw a graph. You
can also add tangent and normal lines to your graph.
Sketch Menu Overview
To access the [Sketch] menu, tap [Analysis] and then [Sketch]. The following table describes
the commands that are available on the [Sketch] menu.
3-6-1
Using the Sketch Menu
Using Sketch Menu Commands
This section describes how to use each of the commands on the [Sketch] menu. Note that all
of the procedures in this section are performed in the Graph & Table application, which you
can enter by tapping the
T
icon on the application menu.
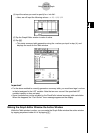
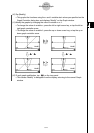
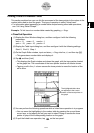
u To plot a point on the Graph window
(1) While the Graph window is active, tap [Analysis], [Sketch], and then [Plot].
(2) Tap the location on the Graph window where you want to plot a point.
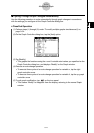
• Instead of tapping the Graph window, you could also use the keypad to specify the
coordinates of the point. Pressing a number key displays a dialog box for inputting
coordinates. The value of the key you just pressed is input for the
x-coordinate. After inputting values for the x- and y-coordinates, tap [OK]
to plot the point at the location you specified.