


20021201
Example 2: Input the paired-variable data shown below (which is the same data as Example
1), and then draw the regression graph without performing regression
calculation.
list1 = 0.5, 1.2, 2.4, 4.0, 5.2
list2 = –2.1, 0.3, 1.5, 2.0, 2.4
u ClassPad Operation
(1) m I
(2) Input the data shown above.
(3) Tap [SetGraph] and then [Setting…], or tap G.
(4) On the Set StatGraphs dialog box that appears, configure a StatGraph setup with the
settings shown below, and then tap [Set].
Draw: On
Type: LogR
XList: list1
YList: list2
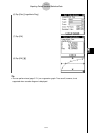
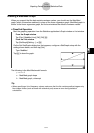
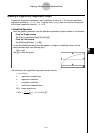
(5) Tap y to graph.
7-5-4
Graphing Paired-Variable Statistical Data
Graphing Previously Calculated Regression Results
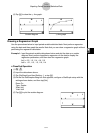
Performing the following procedure graphs the last set of regression results you calculated.
Use this procedure when you want to perform statistical calculations without graphing first,
and then graph the results.
u ClassPad Operation
(1) [SetGraph]
(2) On the menu that appears, select the [Previous Reg] check box.
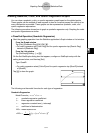
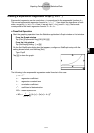
(3) Tap the Graph window or y to graph the last set of regression results you calculated.
Tip
• Calculated regression results are stored in memory whenever you perform a regression
calculation from the List Editor menu or from the Statistical Graph [Calc] menu.
• The [Previous Reg] check box described in step (2) above is selected automatically whenever
you perform a regression calculation from the List Editor menu or from the Statistical Graph
[Calc] menu.